San Francisco Marathon 2008 - 2021: Open Data and Statistics
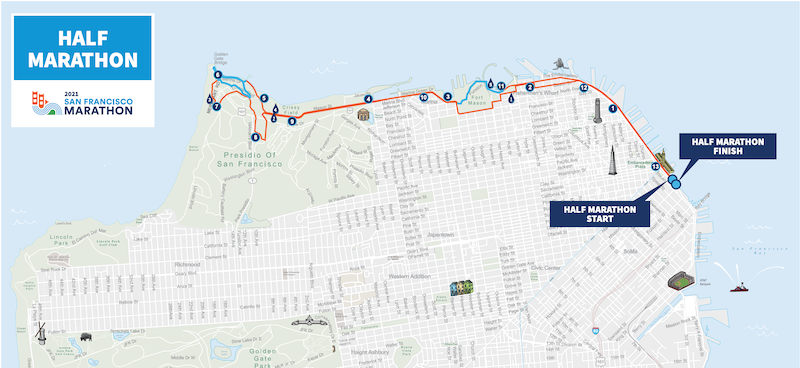
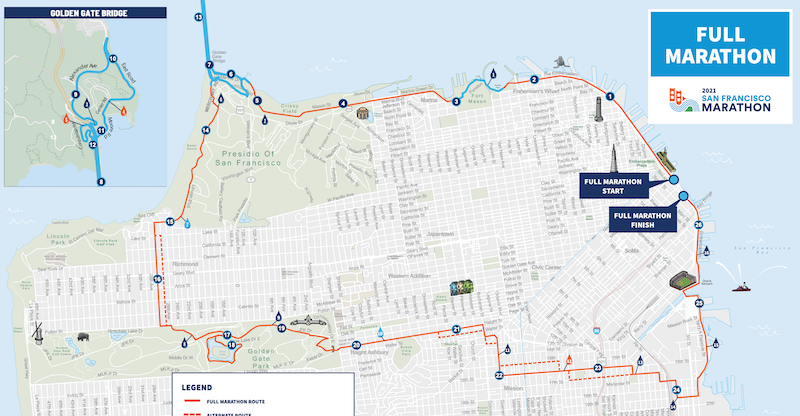
Follow @debarghya_dasOn Sunday, September 19, 2021, I ran a half-marathon (21km) at the 43rd annual San Francisco half-marathon with a personal best time of 1:58:04. The city has been hosting this event ever since 1977 aside from 1988 and 2020, delayed by a very viral disease some readers might have heard of. This was my first official1 half-marathon in America and third in general, following my full marathon at Bangalore in 2018. The San Francisco full marathon (42km) runs from a full circle around the city including running up and down the Golden Gate Bridge, and the half-marathon runs from the start of the Bay Bridge to the Golden Gate Bridge and back to the Embarcadero.
On average, San Francisco, a city known for its accessibility to nature and fitness, gets on average 10903 half marathon runners and 5834 full marathon runners every year, making it the 13th largest in America. This year, however, had fewer runners with only 3185 full marathoners and 5112 half-marathoners - a 45% and then 55% decline respectively! While 99.9% of half-marathon runners completed their race in the stipulated 4hr time limit, only 93.53% of full-marathoners finished in the 6hr time limit.
Usually there are two distinct half-marathons, but this year they were combined into one.
The Basics
The San Francisco full marathon starts at 5:40AM, the half at 6:45AM. San Francisco can be a hilly city and while both routes are largely flat, and I use the word largely generously, the half had a total elevation gain of 200m while the full marathon had a gain of 500m throughout the course. The sun rose at 6:55AM on the day, and towards the end of race, temperatures would be at 18/20C. Because the city’s traffic is blocked off in preparation for the marathon, they aim to wrap up most proceedings by noon, just after the marathon’s 6 hour cut-off time. The half course had 5 aid stations with water, electrolytes, occasionally electrolyte gels, and medical assistance while the full course had 16 aid stations littered somewhat evenly throughout the course.
Data
Results for this race, and all past SF Marathon races since 2008 are available on RunRaceResults. This data includes your rank, name, where you’re from, bib number, net time, pace, gender, category, age, rank in your gender, gun time, and age grade2. I scraped the results to get a pulse on the race myself and to share it more broadly for anyone looking to run the event in the future!
Marathon
Overall Statistics
| San Francisco Marathon 2008 - 2021 | Full Marathon | Half Marathon |
|---|---|---|
| Total Runners | 73,195 | 135,953 |
| Distinct Runners3 | 58,610 | 105,561 |
| Finishers | 68,955 | 135,944 |
| Completion Rate | 94.21% | 99.99% |
Gender Breakdown
The gender breakdown of the San Francisco Marathon was quite surprising to me. One-third of full-marathon runners are women. Unbelievably, the half-marathon is a majority-female race!
| San Francisco Marathon 2008 - 2021 | Full Marathon (Male) | Full Marathon (Female) | Half Marathon (Male) | Half Marathon (Female) |
|---|---|---|---|---|
| Total Runners | 48754 | 24441 | 62623 | 73330 |
| Gender Percentage | 66.6% | 33.4% | 46.1% | 53.9% |
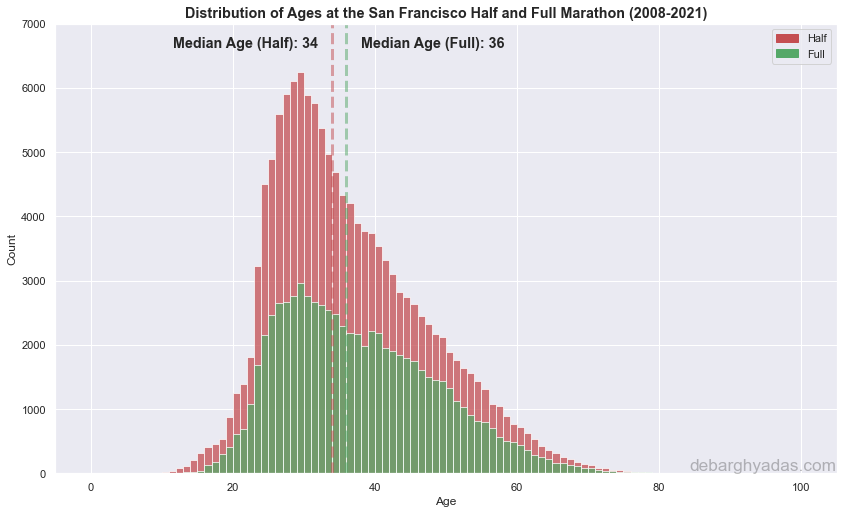
| Mean Age (years) | 38.2 | 35.5 | 37.0 | 35.3 |
| Median Age (years) | 37 | 34 | 35 | 33 |
| Youngest | 11 | 13 | 7 | 8 |
| Oldest | 84 | 80 | 90 | 83 |
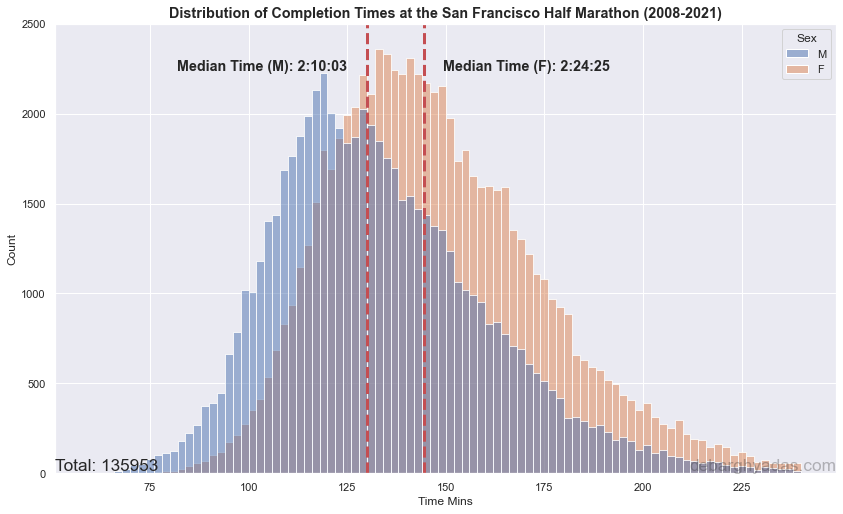
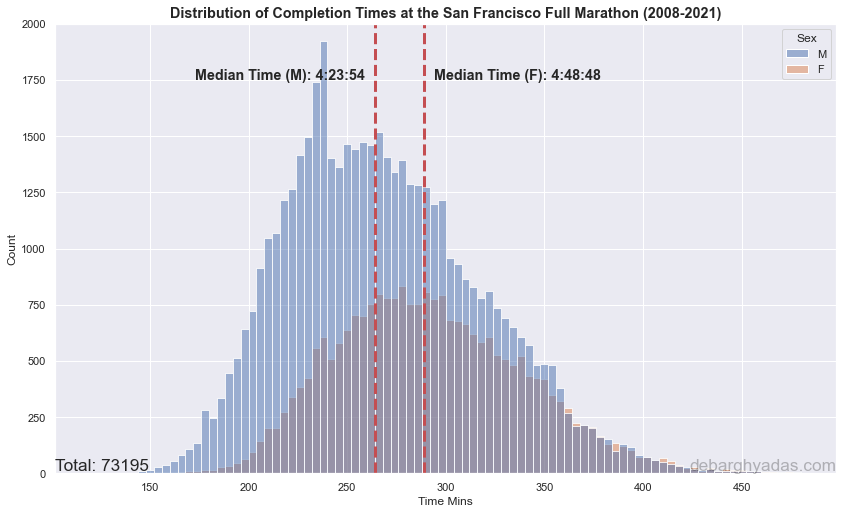
| Mean Time | 4:28:54 | 4:52:37 | 2:13:55 | 2:28:10 |
| Median Time | 4:23:54 | 4:48:48 | 2:10:03 | 2:24:25 |
| Best Time | 2:20:42 | 2:42:26 | 1:03:54 | 1:10:45 |
| Worst Time | 8:52:46 | 9:03:49 | 8:04:34 | 7:28:17 |
Age Category Breakdown
Full marathon runners tend to be slightly older than half-marathon runners. Surprisingly, 13% of all half marathon runners and nearly 15% of all full-marathon runners are above the age of 50. On the other hand, only 32% of half marathon runners and 29% of full marathon runners are under the age of 30.
| San Francisco Marathon 2008 - 2021 | Full Marathon (Male) - Count | Full Marathon (Male) | Full Marathon (Female) - Count | Full Marathon (Female) | Half Marathon (Male) - Count4 | Half Marathon (Male) | Half Marathon (Female) - Count4 | Half Marathon (Female) |
|---|---|---|---|---|---|---|---|---|
| 0-19 | 743 | 4:20:57 | 362 | 4:44:31 | 1430 | 2:08:43 | 1643 | 2:24:47 |
| 20-24 | 3606 | 4:20:26 | 2606 | 4:42:51 | 2063 | 2:06:34 | 3086 | 2:19:20 |
| 25-29 | 8198 | 4:24:02 | 5333 | 4:46:24 | 4886 | 2:11:45 | 5915 | 2:27:19 |
| 30-34 | 8404 | 4:24:53 | 4651 | 4:49:58 | 4777 | 2:14:12 | 4720 | 2:30:53 |
| 35-39 | 7398 | 4:24:59 | 3455 | 4:52:57 | 3427 | 2:15:54 | 3404 | 2:32:15 |
| 40-44 | 6639 | 4:27:57 | 3049 | 4:55:26 | 2670 | 2:18:08 | 2561 | 2:36:10 |
| 45-49 | 5400 | 4:30:00 | 2334 | 4:59:17 | 2125 | 2:20:17 | 2132 | 2:38:45 |
| 50-54 | 3789 | 4:35:34 | 1446 | 5:04:58 | 1499 | 2:20:56 | 1487 | 2:40:47 |
| 55-59 | 2338 | 4:44:18 | 723 | 5:12:14 | 1005 | 2:22:08 | 911 | 2:49:40 |
| 60-64 | 1243 | 4:57:47 | 303 | 5:20:27 | 586 | 2:36:35 | 432 | 2:55:06 |
| 65-69 | 557 | 5:11:58 | 97 | 5:40:05 | 245 | 2:36:35 | 156 | 2:58:46 |
| 70-99 | 235 | 5:26:23 | 38 | 6:14:43 | 309 | 2:51:59 | 152 | 3:12:27 |
Percentile Charts
Percentile Chart - Half Marathon
| Percentile | Overall | M (<30) | M (30-50) | M (>50) | F (<30) | F (30-50) | F (>50) |
|---|---|---|---|---|---|---|---|
| 100% | 1:03:54 | 1:03:54 | 1:05:38 | 1:17:07 | 1:10:45 | 1:15:31 | 1:28:46 |
| 99% | 1:27:52 | 1:17:28 | 1:24:32 | 1:33:18 | 1:34:40 | 1:37:56 | 1:47:16 |
| 95% | 1:41:13 | 1:31:57 | 1:36:48 | 1:44:13 | 1:46:45 | 1:49:59 | 1:59:08 |
| 90% | 1:48:30 | 1:39:03 | 1:43:05 | 1:50:42 | 1:53:19 | 1:56:33 | 2:06:28 |
| 80% | 1:57:28 | 1:47:28 | 1:51:18 | 1:59:03 | 2:01:10 | 2:05:15 | 2:15:49 |
| 75% | 2:00:57 | 1:50:40 | 1:54:35 | 2:02:40 | 2:04:25 | 2:08:51 | 2:20:11 |
| 70% | 2:04:35 | 1:53:39 | 1:57:33 | 2:06:41 | 2:07:32 | 2:12:13 | 2:24:24 |
| 60% | 2:11:20 | 1:59:16 | 2:03:25 | 2:12:58 | 2:13:41 | 2:18:31 | 2:31:38 |
| 50% | 2:18:01 | 2:05:41 | 2:09:57 | 2:19:45 | 2:19:41 | 2:24:56 | 2:39:40 |
| 40% | 2:25:17 | 2:12:03 | 2:16:45 | 2:26:50 | 2:26:04 | 2:31:59 | 2:47:45 |
| 30% | 2:33:33 | 2:19:38 | 2:24:57 | 2:35:01 | 2:33:11 | 2:40:28 | 2:57:00 |
| 25% | 2:38:29 | 2:24:22 | 2:29:20 | 2:39:41 | 2:37:35 | 2:44:59 | 3:01:41 |
| 20% | 2:44:03 | 2:29:29 | 2:34:40 | 2:45:41 | 2:42:34 | 2:50:14 | 3:08:00 |
| 10% | 2:59:04 | 2:44:45 | 2:49:40 | 3:00:35 | 2:55:35 | 3:04:53 | 3:24:35 |
| 5% | 3:13:54 | 2:57:29 | 3:02:55 | 3:16:25 | 3:09:16 | 3:19:10 | 3:38:38 |
| 1% | 3:44:25 | 3:25:38 | 3:33:26 | 3:51:07 | 3:37:27 | 3:47:34 | 4:05:36 |
| 0% | 8:04:34 | 8:04:34 | 6:45:38 | 5:39:32 | 5:46:34 | 7:28:17 | 6:27:46 |
Percentile Chart - Marathon
| Percentile | Overall | M (<30) | M (30-50) | M (>50) | F (<30) | F (30-50) | F(>50) |
|---|---|---|---|---|---|---|---|
| 100% | 2:20:42 | 2:23:29 | 2:20:42 | 2:43:36 | 2:42:26 | 2:44:02 | 3:02:37 |
| 99% | 2:59:22 | 2:48:09 | 2:56:48 | 3:15:43 | 3:18:01 | 3:22:00 | 3:39:43 |
| 95% | 3:22:27 | 3:09:09 | 3:16:49 | 3:33:05 | 3:36:23 | 3:41:36 | 3:56:24 |
| 90% | 3:35:11 | 3:22:41 | 3:28:41 | 3:44:47 | 3:48:24 | 3:54:04 | 4:09:35 |
| 80% | 3:52:32 | 3:40:11 | 3:44:06 | 3:59:57 | 4:04:24 | 4:11:22 | 4:27:49 |
| 75% | 3:58:31 | 3:47:07 | 3:50:43 | 4:07:22 | 4:11:10 | 4:19:01 | 4:35:25 |
| 70% | 4:05:39 | 3:52:45 | 3:56:11 | 4:14:34 | 4:16:59 | 4:25:32 | 4:41:25 |
| 60% | 4:19:32 | 4:04:18 | 4:08:25 | 4:28:37 | 4:28:32 | 4:37:58 | 4:54:28 |
| 50% | 4:32:33 | 4:17:31 | 4:21:29 | 4:41:46 | 4:40:30 | 4:50:00 | 5:07:00 |
| 40% | 4:46:22 | 4:31:26 | 4:34:34 | 4:54:59 | 4:53:23 | 5:02:30 | 5:21:35 |
| 30% | 5:00:57 | 4:47:28 | 4:49:14 | 5:09:51 | 5:07:34 | 5:17:29 | 5:36:49 |
| 25% | 5:10:11 | 4:55:30 | 4:57:38 | 5:19:23 | 5:15:24 | 5:25:15 | 5:45:32 |
| 20% | 5:20:22 | 5:05:31 | 5:07:53 | 5:29:09 | 5:24:58 | 5:34:33 | 5:53:29 |
| 10% | 5:45:07 | 5:31:19 | 5:33:52 | 5:52:24 | 5:48:48 | 5:56:14 | 6:13:38 |
| 5% | 6:04:12 | 5:51:31 | 5:53:18 | 6:12:11 | 6:08:53 | 6:16:01 | 6:38:13 |
| 1% | 6:45:47 | 6:31:55 | 6:33:58 | 6:47:15 | 6:47:15 | 6:55:54 | 7:17:15 |
| 0% | 9:03:49 | 8:26:06 | 8:52:46 | 8:47:00 | 8:43:31 | 9:03:49 | 9:00:34 |
Reverse Percentile Chart - Half Marathon
| Time | Overall | M (<30) | M (30-50) | M (>50) | F (<30) | F (30-50) | F (>50) |
|---|---|---|---|---|---|---|---|
| 1:00:00 | 100.0% | 100.0% | 100.0% | 100.0% | 100.0% | 100.0% | 100.0% |
| 1:05:00 | 100.0% | 100.0% | 100.0% | 100.0% | 100.0% | 100.0% | 100.0% |
| 1:10:00 | 100.0% | 99.8% | 100.0% | 100.0% | 100.0% | 100.0% | 100.0% |
| 1:15:00 | 99.9% | 99.4% | 99.8% | 100.0% | 100.0% | 100.0% | 100.0% |
| 1:20:00 | 99.7% | 98.6% | 99.5% | 100.0% | 99.9% | 100.0% | 100.0% |
| 1:25:00 | 99.3% | 97.5% | 98.9% | 99.8% | 99.9% | 99.9% | 100.0% |
| 1:30:00 | 98.7% | 95.8% | 97.8% | 99.4% | 99.5% | 99.7% | 100.0% |
| 1:35:00 | 97.6% | 93.3% | 96.0% | 98.6% | 98.9% | 99.3% | 99.9% |
| 1:40:00 | 95.6% | 89.1% | 92.5% | 96.9% | 97.8% | 98.7% | 99.7% |
| 1:45:00 | 92.7% | 83.3% | 88.0% | 94.4% | 96.0% | 97.4% | 99.3% |
| 1:50:00 | 88.6% | 76.0% | 81.9% | 90.6% | 92.9% | 95.0% | 98.4% |
| 1:55:00 | 83.2% | 67.7% | 74.4% | 85.5% | 88.3% | 91.5% | 96.8% |
| 2:00:00 | 76.3% | 58.7% | 65.6% | 78.6% | 81.6% | 86.2% | 94.5% |
| 2:05:00 | 69.4% | 50.9% | 57.6% | 71.9% | 74.1% | 80.3% | 91.1% |
| 2:10:00 | 62.0% | 43.1% | 49.9% | 64.5% | 66.0% | 73.2% | 86.4% |
| 2:15:00 | 54.5% | 35.8% | 42.5% | 57.1% | 57.7% | 65.5% | 81.0% |
| 2:20:00 | 47.3% | 29.6% | 35.9% | 49.6% | 49.5% | 57.7% | 75.2% |
| 2:25:00 | 40.4% | 24.3% | 29.9% | 42.4% | 41.7% | 49.9% | 69.2% |
| 2:30:00 | 33.9% | 19.5% | 24.3% | 36.0% | 34.2% | 42.6% | 62.3% |
| 2:35:00 | 28.4% | 15.8% | 19.8% | 30.0% | 27.9% | 36.3% | 55.8% |
| 2:40:00 | 23.6% | 12.7% | 15.9% | 24.7% | 22.5% | 30.6% | 49.6% |
| 2:45:00 | 19.1% | 9.9% | 12.5% | 20.6% | 17.5% | 25.0% | 43.3% |
| 2:50:00 | 15.3% | 7.5% | 9.8% | 16.3% | 13.6% | 20.2% | 37.1% |
| 2:55:00 | 12.1% | 5.7% | 7.6% | 12.9% | 10.3% | 16.1% | 31.8% |
| 3:00:00 | 9.5% | 4.3% | 5.8% | 10.3% | 7.9% | 12.6% | 26.8% |
| 3:05:00 | 7.6% | 3.4% | 4.5% | 8.4% | 6.1% | 10.0% | 22.3% |
| 3:10:00 | 6.0% | 2.6% | 3.5% | 6.7% | 4.8% | 7.9% | 18.6% |
| 3:15:00 | 4.8% | 2.0% | 2.7% | 5.3% | 3.7% | 6.2% | 15.2% |
| 3:20:00 | 3.7% | 1.4% | 2.1% | 4.3% | 2.8% | 4.8% | 12.6% |
| 3:25:00 | 2.9% | 1.0% | 1.6% | 3.3% | 2.1% | 3.7% | 9.9% |
| 3:30:00 | 2.2% | 0.8% | 1.2% | 2.7% | 1.6% | 2.8% | 7.7% |
Reverse Percentile Chart - Marathon
| Time | Overall | M (<30) | M (30-50) | M (>50) | F (<30) | F (30-50) | F (>50) |
|---|---|---|---|---|---|---|---|
| 2:00:00 | 100.0% | 100.0% | 100.0% | 100.0% | 100.0% | 100.0% | 100.0% |
| 2:15:00 | 100.0% | 100.0% | 100.0% | 100.0% | 100.0% | 100.0% | 100.0% |
| 2:30:00 | 100.0% | 99.9% | 100.0% | 100.0% | 100.0% | 100.0% | 100.0% |
| 2:45:00 | 99.8% | 99.2% | 99.7% | 100.0% | 100.0% | 100.0% | 100.0% |
| 3:00:00 | 98.9% | 97.3% | 98.5% | 99.9% | 99.8% | 99.9% | 100.0% |
| 3:15:00 | 96.8% | 93.2% | 95.6% | 99.1% | 99.2% | 99.4% | 99.9% |
| 3:30:00 | 92.2% | 85.9% | 89.1% | 95.9% | 96.8% | 97.8% | 99.7% |
| 3:45:00 | 84.8% | 76.8% | 79.3% | 89.9% | 91.6% | 93.8% | 98.0% |
| 4:00:00 | 73.7% | 63.1% | 66.1% | 79.9% | 82.5% | 86.4% | 93.4% |
| 4:15:00 | 63.3% | 51.9% | 55.0% | 69.8% | 71.7% | 77.6% | 87.3% |
| 4:30:00 | 51.9% | 40.9% | 43.2% | 59.0% | 58.7% | 66.4% | 78.8% |
| 4:45:00 | 41.0% | 31.5% | 32.8% | 47.7% | 46.6% | 54.1% | 67.6% |
| 5:00:00 | 30.6% | 22.4% | 23.6% | 36.1% | 34.9% | 41.7% | 56.2% |
| 5:15:00 | 22.5% | 15.8% | 17.1% | 27.2% | 25.2% | 31.5% | 43.8% |
| 5:30:00 | 15.7% | 10.5% | 11.3% | 19.7% | 17.7% | 22.3% | 34.1% |
| 5:45:00 | 10.0% | 6.4% | 6.9% | 12.7% | 11.2% | 14.7% | 25.4% |
| 6:00:00 | 5.8% | 3.5% | 3.6% | 7.5% | 6.8% | 8.8% | 15.7% |
| 6:15:00 | 3.4% | 2.0% | 2.2% | 4.5% | 4.0% | 5.3% | 9.6% |
| 6:30:00 | 1.9% | 1.1% | 1.2% | 2.5% | 2.0% | 2.9% | 6.4% |
| 6:45:00 | 1.0% | 0.6% | 0.6% | 1.1% | 1.1% | 1.7% | 3.9% |
| 7:00:00 | 0.5% | 0.3% | 0.3% | 0.6% | 0.6% | 0.9% | 2.0% |
| 7:15:00 | 0.3% | 0.2% | 0.2% | 0.4% | 0.3% | 0.6% | 1.1% |
| 7:30:00 | 0.2% | 0.1% | 0.1% | 0.2% | 0.2% | 0.4% | 0.7% |
| 7:45:00 | 0.1% | 0.1% | 0.0% | 0.1% | 0.1% | 0.2% | 0.4% |
| 8:00:00 | 0.1% | 0.0% | 0.0% | 0.0% | 0.1% | 0.1% | 0.3% |
Trivia
Fastest
- The fastest ever male in the full marathon is Greg Billington from San Francisco, CA in 2021 at 2:20:42, age 32.
- The fastest ever female in the full marathon is Anna Bretan from Berkeley, CA in 2013 at 2:42:26, age 28.
- The fastest ever male in the full marathon at or above 50 is Martin Rindahl from Fresno, CA in 2014 at 2:43:36, age 50.
- The fastest ever female in the full marathon at or above 50 is Meghan Arbogast from Corvallis, OR in 2011 at 3:02:37, age 50.
- The fastest ever male in the half-marathon is Jeffrey Eggleston from Flagstaff, AZ in 2012 at 1:03:54, age 27.
- The fastest ever female in the half-marathon is Molly Pritz from Boulder, CO in 2012 at 1:10:45, age 24.
- The fastest ever male in the half marathon at or above 50 is Fred Zalokar from Reno, NV in 2010 at 1:17:07, age 50.
- The fastest ever female in the half marathon at or above 50 is Makie Ohler from Nevada City, CA in 2014 at 1:28:46, age 52.
Youngest and Oldest
- The oldest SF half-marathon runner is Sang Mi Kim from Lakeway, TX in 2012 at an age of 90.
- The oldest half-marathon runner is Dorothy Joy from Yucaipa, CA in 2010 at an age of 83.
- The oldest half marathon runner (female) is Gloria Bassler from Palos Verdes Peninsula, CA in 2017 at age 80.
- The oldest full marathon runner is Gurnam Brard from Stateline, NV in 2014 and Roger Hauge from Excelsior, MN in 2015 at the age of 84.
- The oldest full marathon runner (female) is Gloria Bassler from Palos Verdes Peninsula, CA in 2017 at age 80.
- The youngest half-marathon runner is Christian Ho from Winchester, CA in 2012 at age 7.
- The youngest half marathon runner (female) is Sophie Russell from Austin, Texas in 2014 at age 8.
- The youngest full marathon runner is Kai Charp from Albany, CA in 2015 and Colin Holt in 2012 at age 11.
- The youngest full marathon runner (female) is Jasmine Aguirre (Livermore, CA, 2013), Anna Sandhu (Dublin, CA, 2021), Joseline Barralon (Laguna Niguel, CA, 2010) at age 13.
Indians in Marathons
I’ve always had an inkling that Indians are no good at running. I rarely see people who look like me run marathons, and my Indian friends are rarely into endurance running. I hypothesized that Indians are just not as athletic and don’t culturally grow up with a running background for them to participate and perform effectively in these events. Let’s put this theory to the test.
I used an Indian name bank5 and made sure the names matched my criteria after filtering. I found 6206 Indian SF half-marathon runners, although I’m unclear what the precision or recall of filtering by name was6. This amounts to about 4.5% of all runners in the half marathon. To support my hypothesis, the male Indian median time is 2:23:19 and the female time is 2:40:20 for a fairly similar age distribution, almost 15 minutes slower for both genders than the overall median.
Further, even for full marathons, where 1737 Indians were found (a mere 2.4% of runners), of which 80% were male, the average male time was 4:50:38 and average female time 5:03:20, a full 25 and 15 minutes slower than the average. This also aligns well with the analysis from the Bangalore Marathon in 2018. It’s clear that Indians lag significantly behind the rest of the pack when it comes to long distance running, but I’m cautiously optimistic this divide will close over time7.
Open Data
The raw data from the marathon spreadsheet is embedded below. The marathon data is available in Google Sheets here and the half-marathon data here. The raw CSV and notebooks used to analyze this data is available on Github at deedy/sf-marathon.
-
The other runs were independently logged on Strava and not part of an official hosted race event. ↩
-
An Age-Grade is commonly mistaken to be a percentile, but is rather an age-adjusted score where 100% denotes the best time for your age, 90% is world-class, 80% is national class, 70% is regional class and 60% is local class. ↩
-
This was computed by computing unique (name, birth year) apirs across all the data, which isn’t completely accurate. ↩
-
The Half-Marathon counts may not be appropriate for a distribution because at some point the categories were at 10-year intervals and changed to 5-year intervals. 0-19 and 70-99 are across all years and the other divisions are only for certain more recent years. ↩ ↩2
-
I used the Indian Names Dataset to match on last names, after thresholding on fairly common names and filtering for last names that are typically more closely associated with other races. ↩
-
A quick manual sample showed about 95%+ precision, but the recall is unclear. ↩
-
A similar analysis for the non-Indian Asian community yielded median times not significantly different from the global median. ↩