Don't compare India-US compensation using Purchasing Power Parity
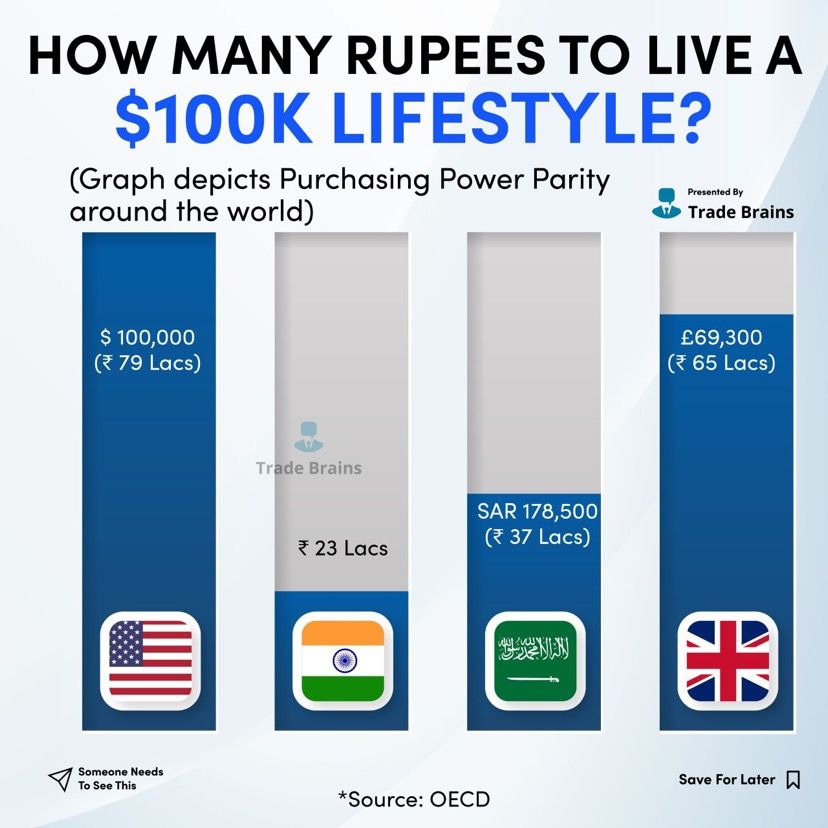
Follow @debarghya_dasEvery few months, I come across a viral post online that uses Purchasing Power Parity (PPP) to compare salaries between the US and India. Take this tweet or this LinkedIn post for example. The comparisons feel sugarcoated – don’t fret about what your friends in the US make, a $100k salary in the US isn’t ₹82 lakh1, it’s only ₹22 lakh2!
Arguments like this try to drive the narrative that one’s income in India is actually sufficient. Countless articles about how large the “packages in the US” have now translated into a deep-seated middle-class belief that going to the US is the path to financial mobility. Those who, often for personal reasons, are employed in India feel defensive about their income - “you can’t just convert their salary into rupees and say they make more!” They’re right.
However, simply using PPP to compare relative income overcompensates for this. Arguments on the other side are few and far between, like this one, but they merely say “PPP isn’t accurate” without positing a numerical alternative. While PPP might say a $100k salary is ₹22 lakh in India, according to some basic back-of-the-envelope calculations in this post, I’d argue that, at a commensurate lifestyle, is about ₹37 lakh back home — an effective PPP of 373.
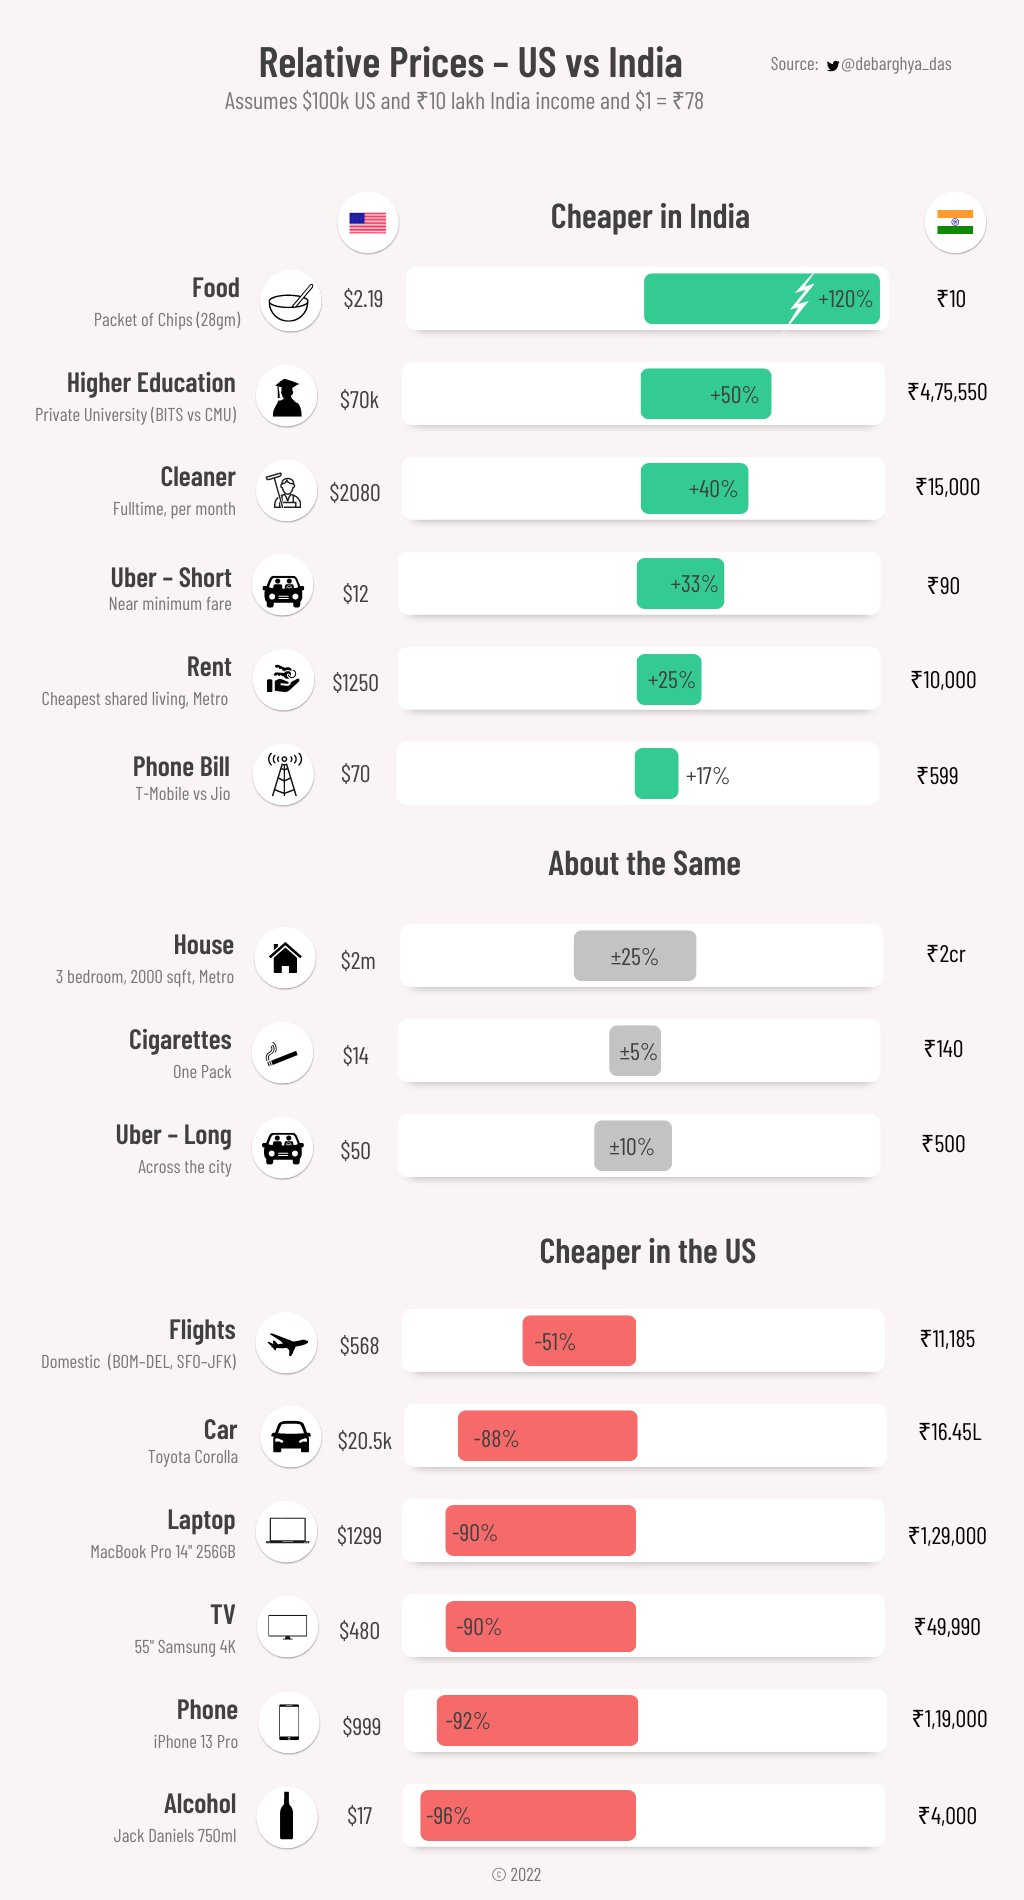
This is a topic I’ve tweeted about several times, including specific price comparisons, explaining why PPP isn’t a good measure, calling out poor comparisons more than once. This blog post aims to be a comprehensive guide to compare India-US salaries.
What is Purchasing Power Parity?
PPP is effectively the ratio of the price of a basket of goods at one location divided by the price of the basket of goods at a different location. So what are these basket of goods? According to the OECD,
The basket of goods and services priced for the PPP exercise is a sample of all goods and services covered by GDP. The final product list covers around 3,000 consumer goods and services, 30 occupations in government, 200 types of equipment goods and about 15 construction projects.
What is PPP used for? Well, it’s not to compare salaries in different countries. PPP is used to
- Compare GDPs in various countries in a more useful way because it takes into account the relative price of things between countries. In other words, two countries could have GDPs of $1T, but if goods were 4x cheaper in one, that country’s GDP is far stronger.
- Estimation of global and regional poverty incidence to monitor Sustainable Development Goal (SDG)
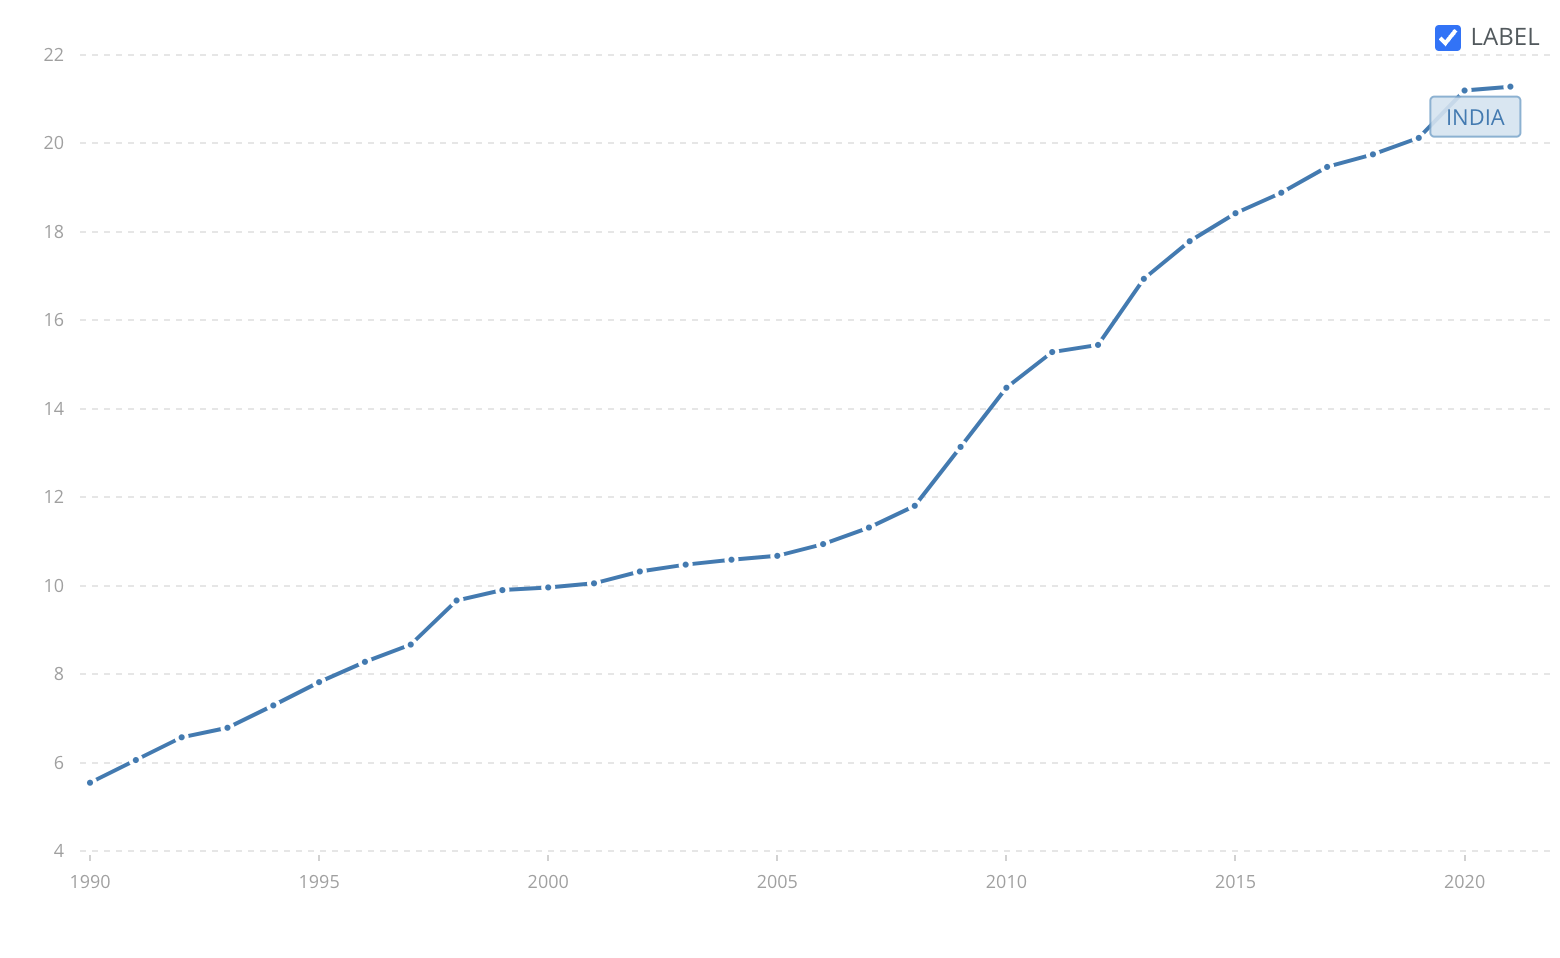
Although the OECD, World Bank, and International Monetary Fund (IMF) all compute PPP, the fundamental data this is based on is the International Comparison Program (ICP), which operates every 6 years, the last being 2017. The ICP is a global statistical program conducted under the United Nations Statistical Program (UNSP).
The most recent values for PPP are:
- OECD — 23.138 (2021)
- World Bank – 21.28 (2021)
- IMF – 23.43 (2022)
This means $100,000 is equivalent to ₹23,43,000 or ₹21,28,000, or ₹21.3–23.4 lakh.
So what are these basket of goods?
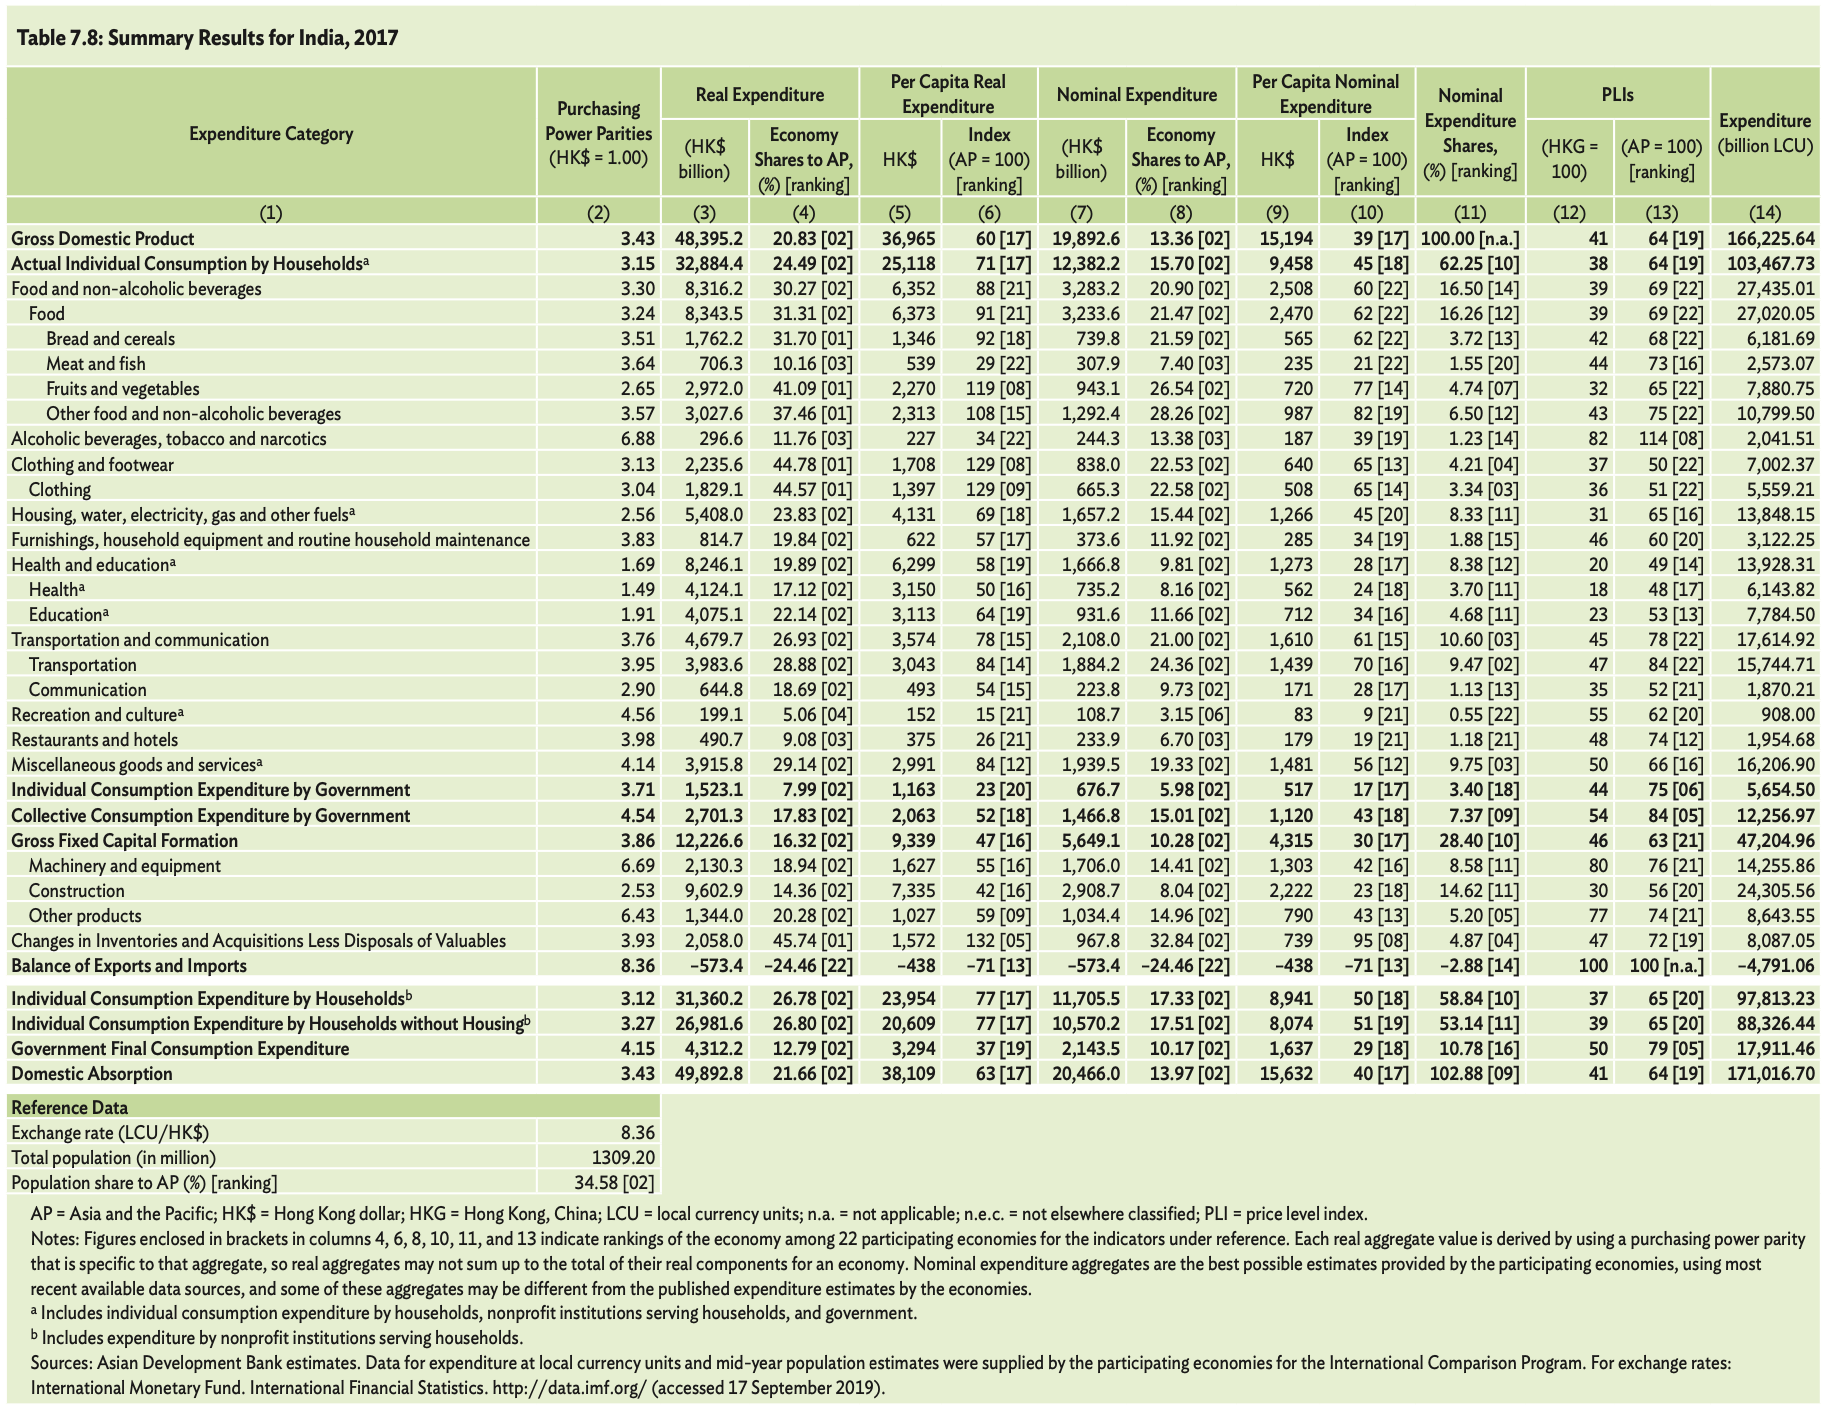
The ICP 2017 for Asia45 was conducted by the ADB (Asian Development Bank) for 22 Asian countries including India. The full details of the report are linked in the ADB official PDF here. Broadly the basket of goods is broken down into 5 areas, which you can explore in the Appendix II of this post.
What if this basket is not my basket?
There are a number of reasons why this specific basket picked for PPP, might not be the right data to use for your basket.
- Methodology Issues Some simplifying assumptions must be made to collect this data, but all of them don’t apply to most. For example, the ICP calculation looks at 577 urban “markets” (a city can have multiple markets) with 163 affluent ones, 314 middle income ones and 100 poor ones including all towns with above 1 million people.
- Net PPP uses categories outside individual expense It stands to reason that of the 5 components of GDP, for a personal finance comparison, we only care about ICEH PPP, or Individual Consumption Expenditure by Household, which is 3.15. This actually reduces the effective PPP to ~24.6. The reason this number varies from the annual reported number is because it fluctuates with the exchange rate.
- Using CPI Infrastructure is less accurate In India, the Consumer Price Index (CPI) was used to estimate these relative prices. ICP categories don’t really align with CPI so, as per the doc, “categorization was made following subjective criteria and consistency in the price movement of ICP and CPI items at basic heading levels”.
- Outlier Categories We can use World Bank Databank6 to get a neater, more structured form of the data with PPP broken down by category in comparison to USD.
- Health (PPP is 8.9), Education (9.6) and Housing (13.2) are far cheaper in India.
- Alcohol (82.6), Vehicles (49.7) and Machinery / Electronics (62.2) are more expensive in India.
Reasons why PPP-based compensation comparison doesn’t make sense
We’ve established that the basket of goods used in a PPP calculation does not accurately reflect most people’s actual spending habits. There’s many other factors too:
- Stage of Life Your spending habits change significantly from when you’re a single earning employee to being married, to having kids, to having college-going kids, to being retired. The effect PPP for each of these life stages is different. When you have kids, the PPP is lower (health, education, housing are cheaper in India). When you’re single, it’s higher (alcohol, vehicles, leisure, travel are cheaper in the US).
- Fundamental spending differences In the US, you’re likely to pay slightly more tax. In India, you typically would spend on labor: a cook, a maid and a driver.
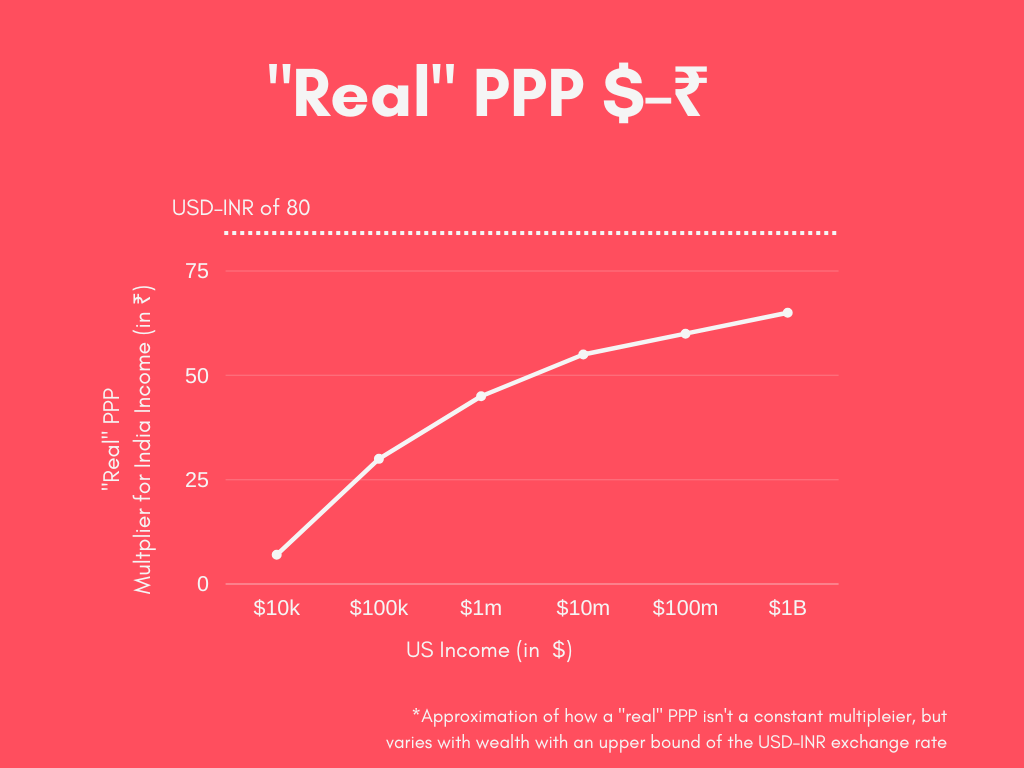
- Wealth As your wealth increases in both India and the US, PPP rises. In other words, the exchange rate becomes closer to an accurate comparison. If you are a high net worth individual, you’re likely purchasing more and more things that are similarly priced — real estate, investments, business.
- Similar quality services are priced differently From a PPP perspective, you might think that buying a standard smartphone in India is relatively similar to purchasing an iPhone in the US. In practice, at the same income bracket, you probably want an iPhone in India too, which is much more expensive. The same argument applies for cars.
- Savings is absolute For many, at least early on in your career, all of the money you save after taxes and spending is used to support parents, extra travel and investments. For this argument, we compare savings on an absolute level not with PPP.
- Fundamental lifestyle differences We are trying to measure how much income in different countries yields the same lifestyle. However, to a large extent lifestyle can never be the same across two countries fundamentally. There is no dollar amount you can put on walkability and pollution. Similarly, there’s no way to estimate the sanctity of not having to worry about a visa, being closer to family and having the best Indian food all day. That’s for a different blog post.
- Others
- In India, you often have to work much longer hours to pull an equivalent salary.
- In the US, salary increases are often much steeper than India.
- Jobs in India that pay as much even PPP-adjusted to the US are few and far between.
Sample spending comparison
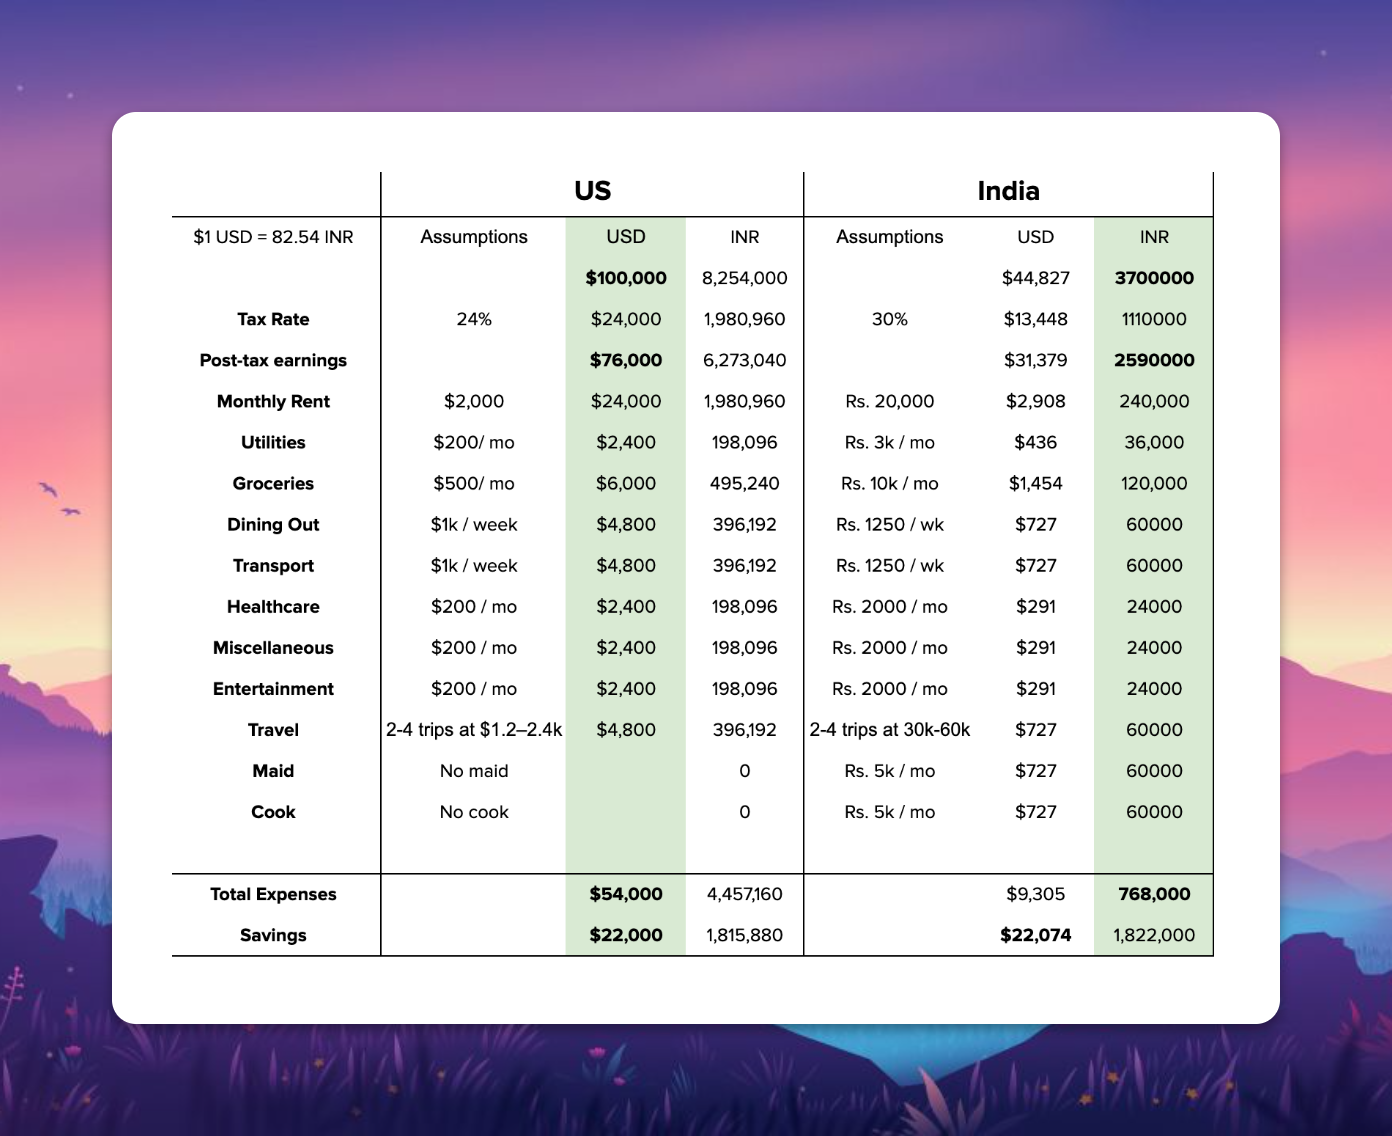
The effective PPP is 37. Source: self, estimated.
According to my basic assumptions, a $100k for a single taxpayer with no dependents in the Bay Area could save $22k / year with a reasonable lifestyle. To save a similar amount of cash in India would require ₹37 lakh per annum. Remember, this changes with stage of life, degree of wealth, spending habits and does not account for fundamental lifestyle differences between the two countries.
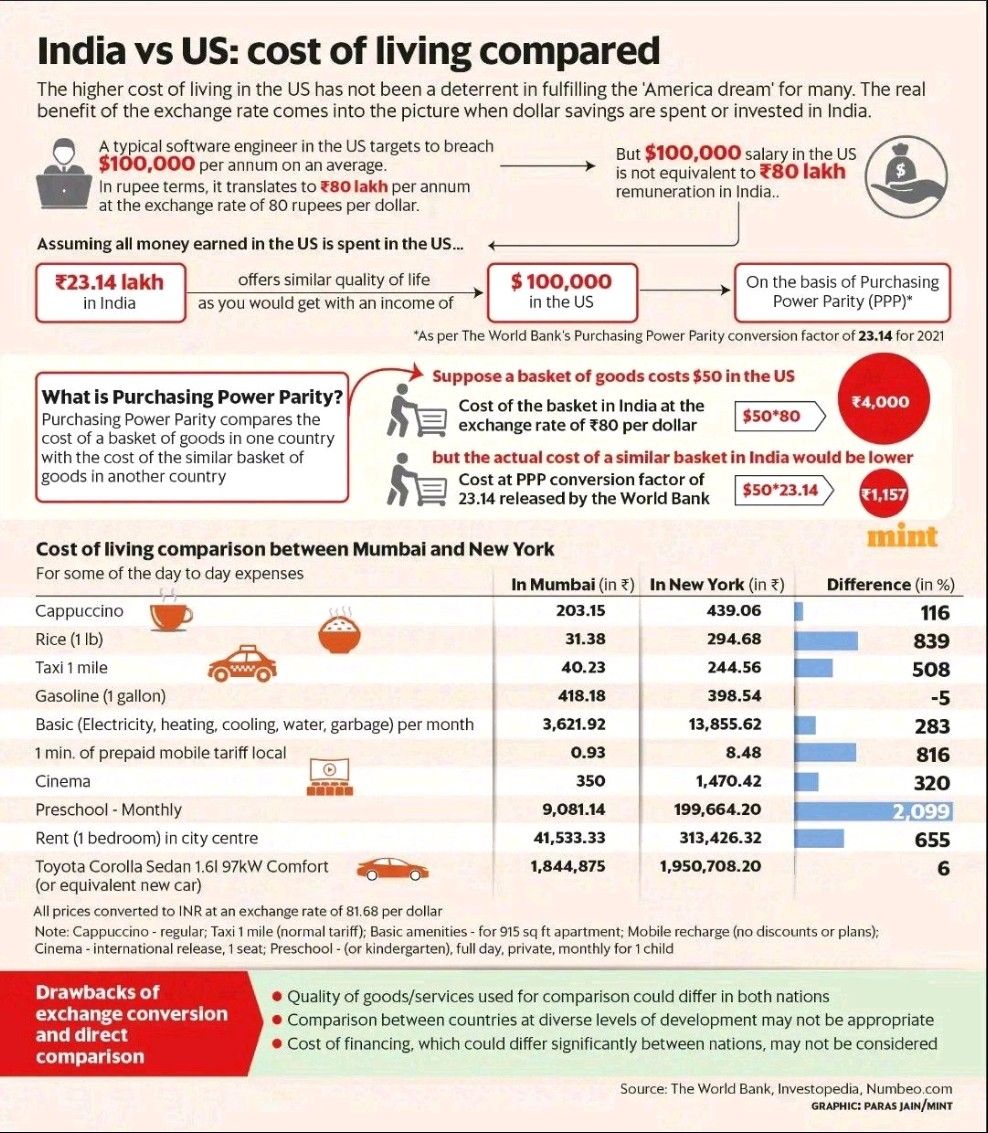
Appendix I: Other Popular Infographics
Appendix II: Basket of Goods
GDP = ICEH + NPISH + GFCE + GCF + Export/Import
- Individual Consumption Expenditure by Household [ICEH]
- Food
- Alcohol, Tobacco and Narcotics
- Clothing, Footwear
- Housing, Water, Electricity, Gas and Fuel
- Furnishing, household maintenance
- Health
- Transport
- Communication
- Reacreation and Culture
- Education
- Restaurants, Hotels
- Miscellaneous
- Individual Consumption Expenditure by Non-profit Institutions Serving Households [NPISH]
- Housing
- Health
- Recreation and Culture
- Education
- Social Protection
- Other Services
- Government Final Consumption Expenditure [GFCE]
- Individual Consumption Expenditure (Same categories as NPISH)
- Collective Consumption Expenditure
- Gross Capital Formation [GCF]
- Machinery
- Metal Products
- Transport Equipment
- Construction
- Residential Buildings
- Non-residential Buildings
- Civil Engineering Works
- Other
- Change in Inventory
- Balance of Exports and Imports
-
USD-INR is 82.6 and PPP ~22 depending on the source at the time of writing this ↩
-
This compares a single taxpayer usually of age 22-30 in the Bay Area / New York vs Bangalore / Delhi (not Mumbai), usually early in their career. ↩
-
To explore the World Bank ICP 2017 data for the PPP by spending category, pick Country India, Classification all, Series all and Time 2017. ↩