Wait times for Indians not just on EB-2/3, but EB-1 USA green cards looks bad [2023]
Follow @debarghya_dasIf you’re an Indian working and trying to move to the US, you probably know that trying to get a green card in the US is a painful, insurmountable task. A commonly thrown out number is the dreaded “150 year” long wait for Indians.
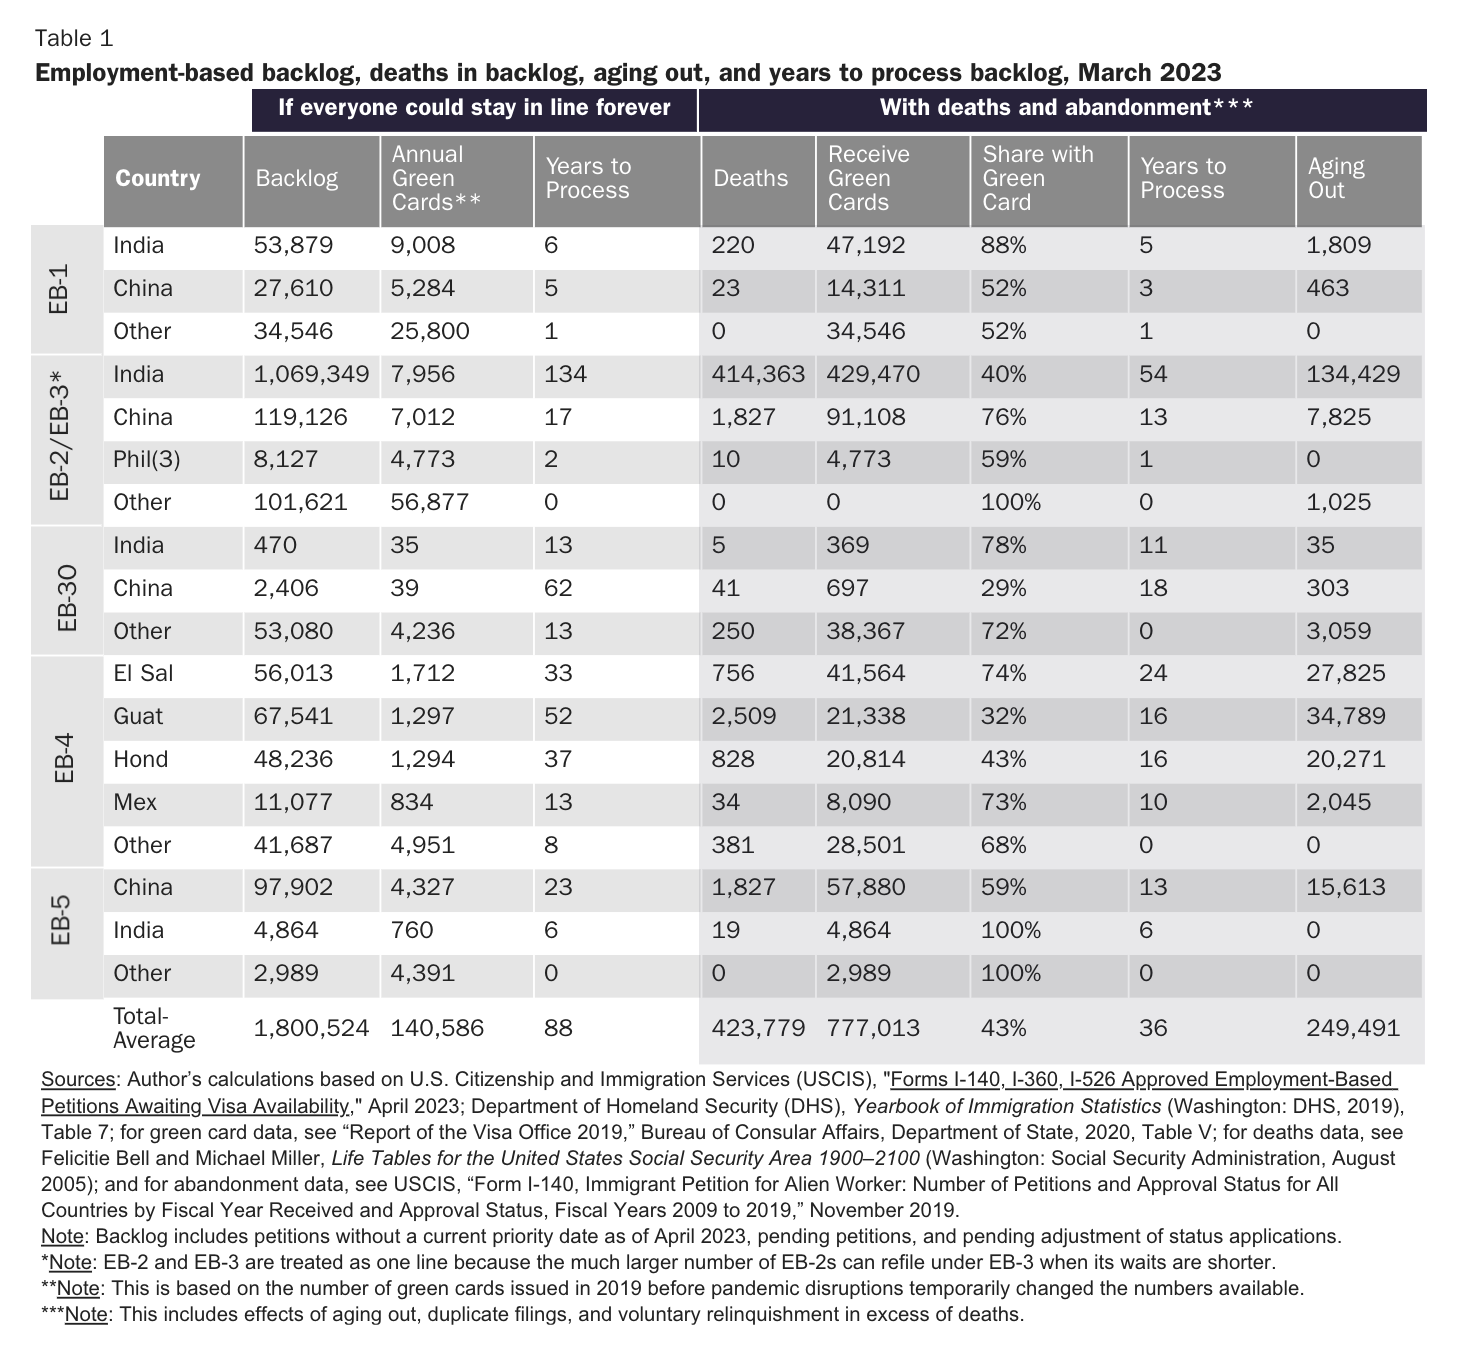
The source that I tracked the 150 year wait time down to is David Bier’s article for Cato, a think tank he works at, entitled 150‐Year Wait for Indian Immigrants With Advanced Degrees in June 2018. He followed this up recently with a post called 1.8 Million in Employment‐Based Green Card Backlog in August 2023 which also identified that there were 1.1 million Indians in the backlog (something I’d tweeted about). Yet another source was my own lawyer, Sophie Alcorn’s article on the same for 2018-23.
David comes to the conclusion that Indians need 134 years before they can get an EB-2/3 visa, the most common one for workers. He had a beautiful diagram explaining his calculations, but I found it inscrutable. How’d he get this number and what does the future look like? In this blog post:
- I meticulously follow each of the citations and explain exactly where these numbers come from (so you can do this calculation in the future)
- I point out an error in David’s blog about how EB-1 backlog was estimated.
- I update his calculations with the latest Q3 2023 esitimates (his was on Q2 2023).
- Make some scary findings about the future of the EB-1 wait times as well!

Piece 1 of the puzzle: The backlog
The USCIS releases a data sheet every quarter called “Number of Form I-140, I-360, I-526 Approved Employment-Based Petitions Awaiting Visa Availability” by Preference Category and Country of Birth. David’s piece was written when Q2 2023 was available, so I’ll be redoing this for Q3 2023, the latest available at the time of writing this. It was published Sep 21, 2023 which means we can expect the Q4 results in late December. This explains David Bier’s caption “Note: Backlog includes petitions without a current priority date as of April 2023, pending petitions, and pending adjustment of status applications.” except we’re using a later quarter, June 2023.
| Q3 2023 | Backlog for Indians |
| EB-1 | 10,049 |
| EB-2 | 426,465 |
| EB-3 | 133,409 |
| EB-2+3 | 559,874 |
| EB-4 | 2100 |
| EB-5 | 333 |
The first thing that you’ll notice is that these numbers are far lower than the 1.1 million David quoted. Where are these coming from? Well, it comes from family members, children and spouses of the approved. But how would we know how many family members to expect in each category?
Piece 2 of the puzzle: Family members!
The ratio of family members to principal applicants vary per category and per year, and this comes from the DHS’s Yearbook of Immigration, the latest one being 2022. This isn’t just for Indians but we use the aggregate ratio instead.
Here are the calculations just for EB-1, but similar apply for 2 and 3 as well. We omit EB-4 and 5 because their priority dates are usually current and they’re not crowded categories.
| First: Priority workers | 53,433 |
53,433 |
||
| Workers with extraordinary ability, new arrivals (E11) | 2,120 |
|||
| Workers with extraordinary ability, adjustments (E16) | 5,379 |
|||
| Outstanding professors or researchers, new arrivals (E12) | 22 |
|||
| Outstanding professors or researchers, adjustments (E17) | 4,425 |
|||
| Multinational executives or managers, new arrivals (E13) | 174 |
|||
| Multinational executives or managers, adjustments (E18) | 10,116 |
22,236 |
Principal | |
| Spouses of E11, E12, E13, E16, E17, or E18, new arrivals (E14) | 1,699 |
|||
| Spouses of E11, E12, E13, E16, E17, or E18, adjustments (E19) | 15,386 |
17,085 |
Spouses | 2.40 |
| Children of E11, E12, E13, E16, E17, or E18, new arrivals (E15) | 2,075 |
|||
| Children of E11, E12, E13, E16, E17, or E18, adjustments (E10) | 12,037 |
14,112 |
Children |
The way we compute the principal:total family member ratio for a category is ((Spouses + Children) / Principal) + 1. For EB-1 in 2022, this is (17085+14112)/22236 + 1 = 2.4. The total number of visas granted will be 2.4x the number of principal applicants.
Just to double check that this number didn’t vary too much by year, I did the math for 2021 as well. Here are the final numbers we get for 2021 and 2022:
2021 |
2022 |
|
| EB-1 | 2.36 |
2.40 |
| EB-2 | 1.96 |
2.00 |
| EB-3 | 1.91 |
1.97 |
Combining these numbers with the latest backlog numbers, we get the “True” backlog numbers because family members count towards the final employment based visa issue limits. Some other websites take a 20% discount on this value because of dual applications in multiple other visa categories.
| Backlog (Q3 2023) | Multiplier (2022 numbers) | Family-added backlog (Q3 2023) | |
| EB-1 | 10,049 |
2.40 |
24,148 |
| EB-2 | 426,465 |
2.00 |
853,705 |
| EB-3 | 133,409 |
1.97 |
262,792 |
| EB-2+3 | 559,874 |
1,116,497 |
Then, you’ll notice an important note in the citation from David: “EB-2 and EB-3 are treated as one line because the much larger number of EB-2s can refile under EB-3 when its waits are shorter.” We combine the numbers too and treat it as 1 line to get a total of 1,116,497 EB-2/3 Indians in the backlog and 24,148 EB-1s. There are about 46x more EB-2+3 in the backlog compared to EB-1s.
Piece 3 of the puzzle: Visas Issued
Now we know the “real” backlog numbers, but how many visas in each category are actually issued every year? This was another wild goose hunt and a completely different source. The last two sources were from the USCIS and the DHS and this one is from the US Department of State’s Annual Report of the Visa Office. We use the latest 2022 report, specifically the “Immigrant Visas Issued and Adjustments of Status Subject to Numerical Limitations (by Foreign State of Chargeability): Fiscal Year 2022”. This tells us the number of actual visas issued by country (to Indians in this case) by category (EB-1/2/3).
This one is interesting, because we need to go really far back in history to understand the trends here.
2012 |
2013 |
2014 |
2015 |
2016 |
2017 |
2018 |
2019 |
2020 |
2021 |
2022 |
2023 (projected) | |
| EB-1 Family | 8,470 |
10,934 |
15,031 |
14,455 |
18,250 |
20,067 |
17,889 |
16,258 |
14,519 |
11,269 |
15,899 |
27,231 |
| EB-1 Issued | 9,506 |
9,640 |
12,978 |
12,253 |
10,985 |
13,082 |
10,967 |
9,008 |
17,014 |
30,825 |
21,437 |
? |
| Backlog Change | 1,036 |
-1,294 |
-2,053 |
-2,202 |
-7,265 |
-6,985 |
-6,922 |
-7,250 |
2,495 |
19,556 |
5,538 |
|
| Source | Source | Source | Source | Source |
We see a huge spike in EB-2 and EB-3 grants for Indians during the pandemic. The reason was that with travel being cut short, the number of family green cards issued were much lower. These visas spilled over to employment-based green cards. In 2021, 122k family green cards spilled over to add to the 140k employment visas to get 262k. In 2022, 141k spilled over to get 281.5k employment visas. In 2023, 57k spilled over to get 197k employment visas. 28.6% of these.
Remember, 28.6% of this number gets allocated to EB-1/2/3 and 7.1% to EB-4/5 each for a total of 100%. EB-5 Investor visa and EB-4 Religious Workers gets considered first and the unused ones carry over to EB-1 then EB-2 and then EB-3. Each country, including India, has a cap of 7% of the visas allocated in each category not including the spillover.
When I did all the diligent math for 2019 to 2023, something didn’t add up. Even counting the EB-4 and EB-5 spillover, and assuming 7% cap for India for each category, the computed EB-1 limit I got was always significantly lower than the actual number issued. Any help understanding exactly what I’m doing wrong would help here, but it doesn’t significantly affect the calculations downstream. The rest of the gap is filled by EB-1 spillover from the rest of the world countries.
| Employment-based Cap | Family Spillover | Total Employment-based visas | EB-1 Limit (28.6%) | EB-1 India Cap (7%) | EB-4 Limit (7.1%) | EB-5 Limit (7.1%) | Lower bound of EB-1 | Upper bound of EB-1 for Indians** | EB-5 Issued | EB-4 Issued | EB-1 India Limit* | EB-1 issued to Indians | EB-4 + EB-1 Source | EB-5 Source | |
2019 |
140,000 |
1,918 |
141,918 |
40,589 |
2,841 |
10,076 |
10,076 |
2,841 |
22,994 |
9,478 |
10,088 |
3,428 |
9,008 |
Source | Source |
2020 |
140,000 |
16,254 |
156,254 |
44,689 |
3,128 |
11,094 |
11,094 |
3,128 |
25,316 |
3,596 |
10,406 |
11,314 |
17,014 |
Source | |
2021 |
140,000 |
122,000 |
262,000 |
74,932 |
5,245 |
18,602 |
18,602 |
5,245 |
42,449 |
2,949 |
15,666 |
23,834 |
30,825 |
Source | Source |
2022 |
140,000 |
141,507 |
281,507 |
80,511 |
5,636 |
19,987 |
19,987 |
5,636 |
45,610 |
6,882 |
19,921 |
18,807 |
21,437 |
Source | Source |
2023 |
140,000 |
57,091 |
197,091 |
56,368 |
3,946 |
13,993 |
13,993 |
3,946 |
31,933 |
— | — | — | — |
* EB-1 India limit = EB-4 Limit - EB-4 Issued + EB-5 Limit - EB-5 Issued + EB-1 India Cap
** Assuming all EB-4 and EB-5 spills over
That said, the actual visas issued number checks out another citation in David’s article “This is based on the number of green cards issued in 2019 before pandemic disruptions temporarily changed the numbers available.” — notice that Indians up until 2019 were getting 9,008 Indian EB-1s, and 7,956 Indian EB-2s, which checks out with David’s chart.
Pre-pandemic, from 2012-2019, the EB-1s issued to Indians always hovered in the 9-13k range, so David assumes that that’s a fine assumption to use going forward. The EB-2/3 visa issued to Indians in 2016-19 also hovered around the 8-10k range. These are reliable ranges to work with going forward since 2020-2022 was quite an anomaly with the pandemic.
Putting it all together!
Using the (a) pre-pandemic 2019 green card issue rates from the DoS Annual Visa Report, (b) the backlog numbers from the USCIS report and (c) the family ratios from the DHS Year of Immigration, we can simply divide the backlog by the visas issued to know the wait time (we ignore deaths and aging out for simplicity here). This comes out to 2.68yrs for EB-1 and 140.3yrs for EB-2/3, which is a slight update to the 6yrs and 134yrs on David’s article.
In fact, I actually think the EB-1 figure David has is wrong — the 53,879 backlog would apply a ridiculous 5x family ratio over the 10k or so backlog.
Note, that this calculation has so many assumptions!
- [not safe] We used the 2019 visa issued rate even though there’s no guarantee that this is the future stable state.
- [safe] The multipliers used may change over time as the families age and have kids. This is a safe assumption because it won’t fluctuate by too much from year to year.
- [not safe] In the future, the backlog changes and your wait time if you apply 1 year now is very different from now.
| Backlog | Multiplier | Family | Visas Issued* | Wait time | |
| EB-1 | 10,049 |
2.40 |
24,148 |
9,008 |
2.68yrs |
| EB-2 | 426,465 |
2.00 |
853,705 |
||
| EB-3 | 133,409 |
1.97 |
262,792 |
||
| EB-2+3 | 559,874 |
1,116,497 |
7,956 |
140.3yrs |
* Using the pre-pandemic stable 2019 visa issue rate
Bonus Piece: Predicting the future!
The wait time calculated above is a bit naive, even given our assumptions. There are two caveats:
- Many, if not most, EB-1 Indian applicants port over an older priority date from their EB-2/3, effectively increasing the wait time for someone with a priority date today in the future. In other words, if your priority date is not current today, in Nov 2023, in a year, your wait time may continue to increase even if a sizable number of visas are issued because others “cut ahead of you” in line by porting their old EB-2/EB-3 priority date (usually from 2012, the EB-2/3 date, to now).
- For EB-2/3, if you have a pending application today, this wait time is mostly correct if the visas issued doesn’t change much. However, this wait increases as the backlog continues to increase by year. This is because the sink is being filled with water faster than it can leak out.
To predict how this will change in the future, we can try to find how many people are applying for EB-1/2/3 in 2023. We grab USCIS’s “Number of Form I-140, Immigrant Petition for Alien Worker Petitions Received and Current Status for All Countries” (I found one from 2012 to 2022 Q1/Q2). I filled out 2022 from the full Q1-Q4 of that year and then added Q1 2023, Q2 2023 and Q3 2023 and applied a 4/3 multiplier to get the number of approvals for 2023. Here’s the math behind computing the projections for FY 2023:
| EB Approved 2023 to Indians | FY2023 (Projected) | Q1-Q3 2023 | Q3 2023 | Q2 2023 | Q1 2023 | ||||||
EB-1A |
2037 |
1,528 |
542 |
489 |
497 |
||||||
EB-1B |
1728 |
1,296 |
375 |
413 |
508 |
||||||
EB-1C |
7773 |
5,830 |
1796 |
2116 |
1918 |
||||||
EB-1 Total |
11539 |
||||||||||
| E21/ E32 | NIW / E32 | E21/ E32 | NIW / E32 | E21/ E32 | NIW / E32 | ||||||
EB-2 |
77547 |
58,160 |
8,886 |
8,390 |
496 |
10,060 |
9455 |
605 |
10,134 |
9684 |
450 |
EB-3 |
28304 |
21,228 |
2,953 |
634 |
2,319 |
3779 |
894 |
2885 |
3882 |
683 |
3199 |
We then apply the family ratio to get the true backlog and then join it with the visas issued numbers for Indians on EB-1 / 2 / 3 over the last 10 years:
| India | 2012 |
2013 |
2014 |
2015 |
2016 |
2017 |
2018 |
2019 |
2020 |
2021 |
2022 |
2023 (projected) |
| EB-1A | 412 |
632 |
820 |
940 |
1,126 |
1,391 |
1,268 |
942 |
885 |
1,166 |
1378 |
2037 |
| EB-1B | 766 |
948 |
985 |
1,020 |
1,071 |
1,136 |
1,230 |
933 |
837 |
1,125 |
1293 |
1728 |
| EB-1C | 2,411 |
3,053 |
4,564 |
4,165 |
5,536 |
5,976 |
5,082 |
5,014 |
4,430 |
2,484 |
4066 |
7773 |
| EB-1 Total | 3589 |
4633 |
6369 |
6125 |
7,733 |
8,503 |
7,580 |
6889 |
6152 |
4,775 |
6737 |
11539 |
| EB-1 Family Ratio | 2.36 |
2.36 |
2.36 |
2.36 |
2.36 |
2.36 |
2.36 |
2.36 |
2.36 |
2.36 |
2.36 |
2.36 |
| EB-1 + Family Applicants | 8,470 |
10,934 |
15,031 |
14,455 |
18,250 |
20,067 |
17,889 |
16,258 |
14,519 |
11,269 |
15,899 |
27,231 |
| EB-2 Total | 22,016 |
21,004 |
25,089 |
31,641 |
47,626 |
41,260 |
39,491 |
43,844 |
35,592 |
35,386 |
44,523 |
77547 |
| EB-3 Total | 4,064 |
3,411 |
3,838 |
6,252 |
9,962 |
8,700 |
8,159 |
11,355 |
9,196 |
41,478 |
16,253 |
28304 |
| EB-2 family ratio | 2.00 |
2.00 |
2.00 |
2.00 |
2.00 |
2.00 |
2.00 |
2.00 |
2.00 |
2.00 |
2.00 |
2.00 |
| EB-3 family ratio | 1.97 |
1.97 |
1.97 |
1.97 |
1.97 |
1.97 |
1.97 |
1.97 |
1.97 |
1.97 |
1.97 |
1.97 |
| EB-2 + Family applicants | 44,032 |
42,008 |
50,178 |
63,282 |
95,252 |
82,520 |
78,982 |
87,688 |
71,184 |
70,772 |
89,046 |
155,093 |
| EB-3 + Family applicants | 8,006 |
6,720 |
7,561 |
12,316 |
19,625 |
17,139 |
16,073 |
22,369 |
18,116 |
81,712 |
32,018 |
55,759 |
| EB2+3 Family | 52,038 |
48,728 |
57,739 |
75,598 |
114,877 |
99,659 |
95,055 |
110,057 |
89,300 |
152,484 |
121,064 |
210,852 |
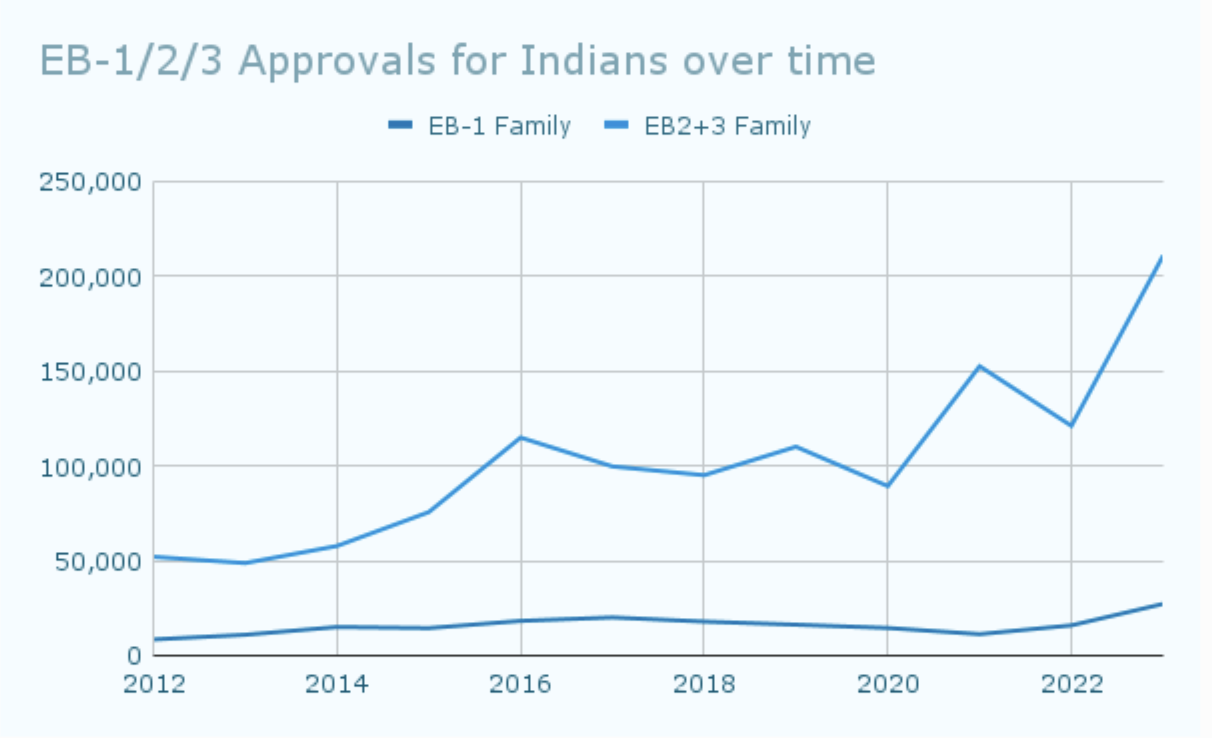
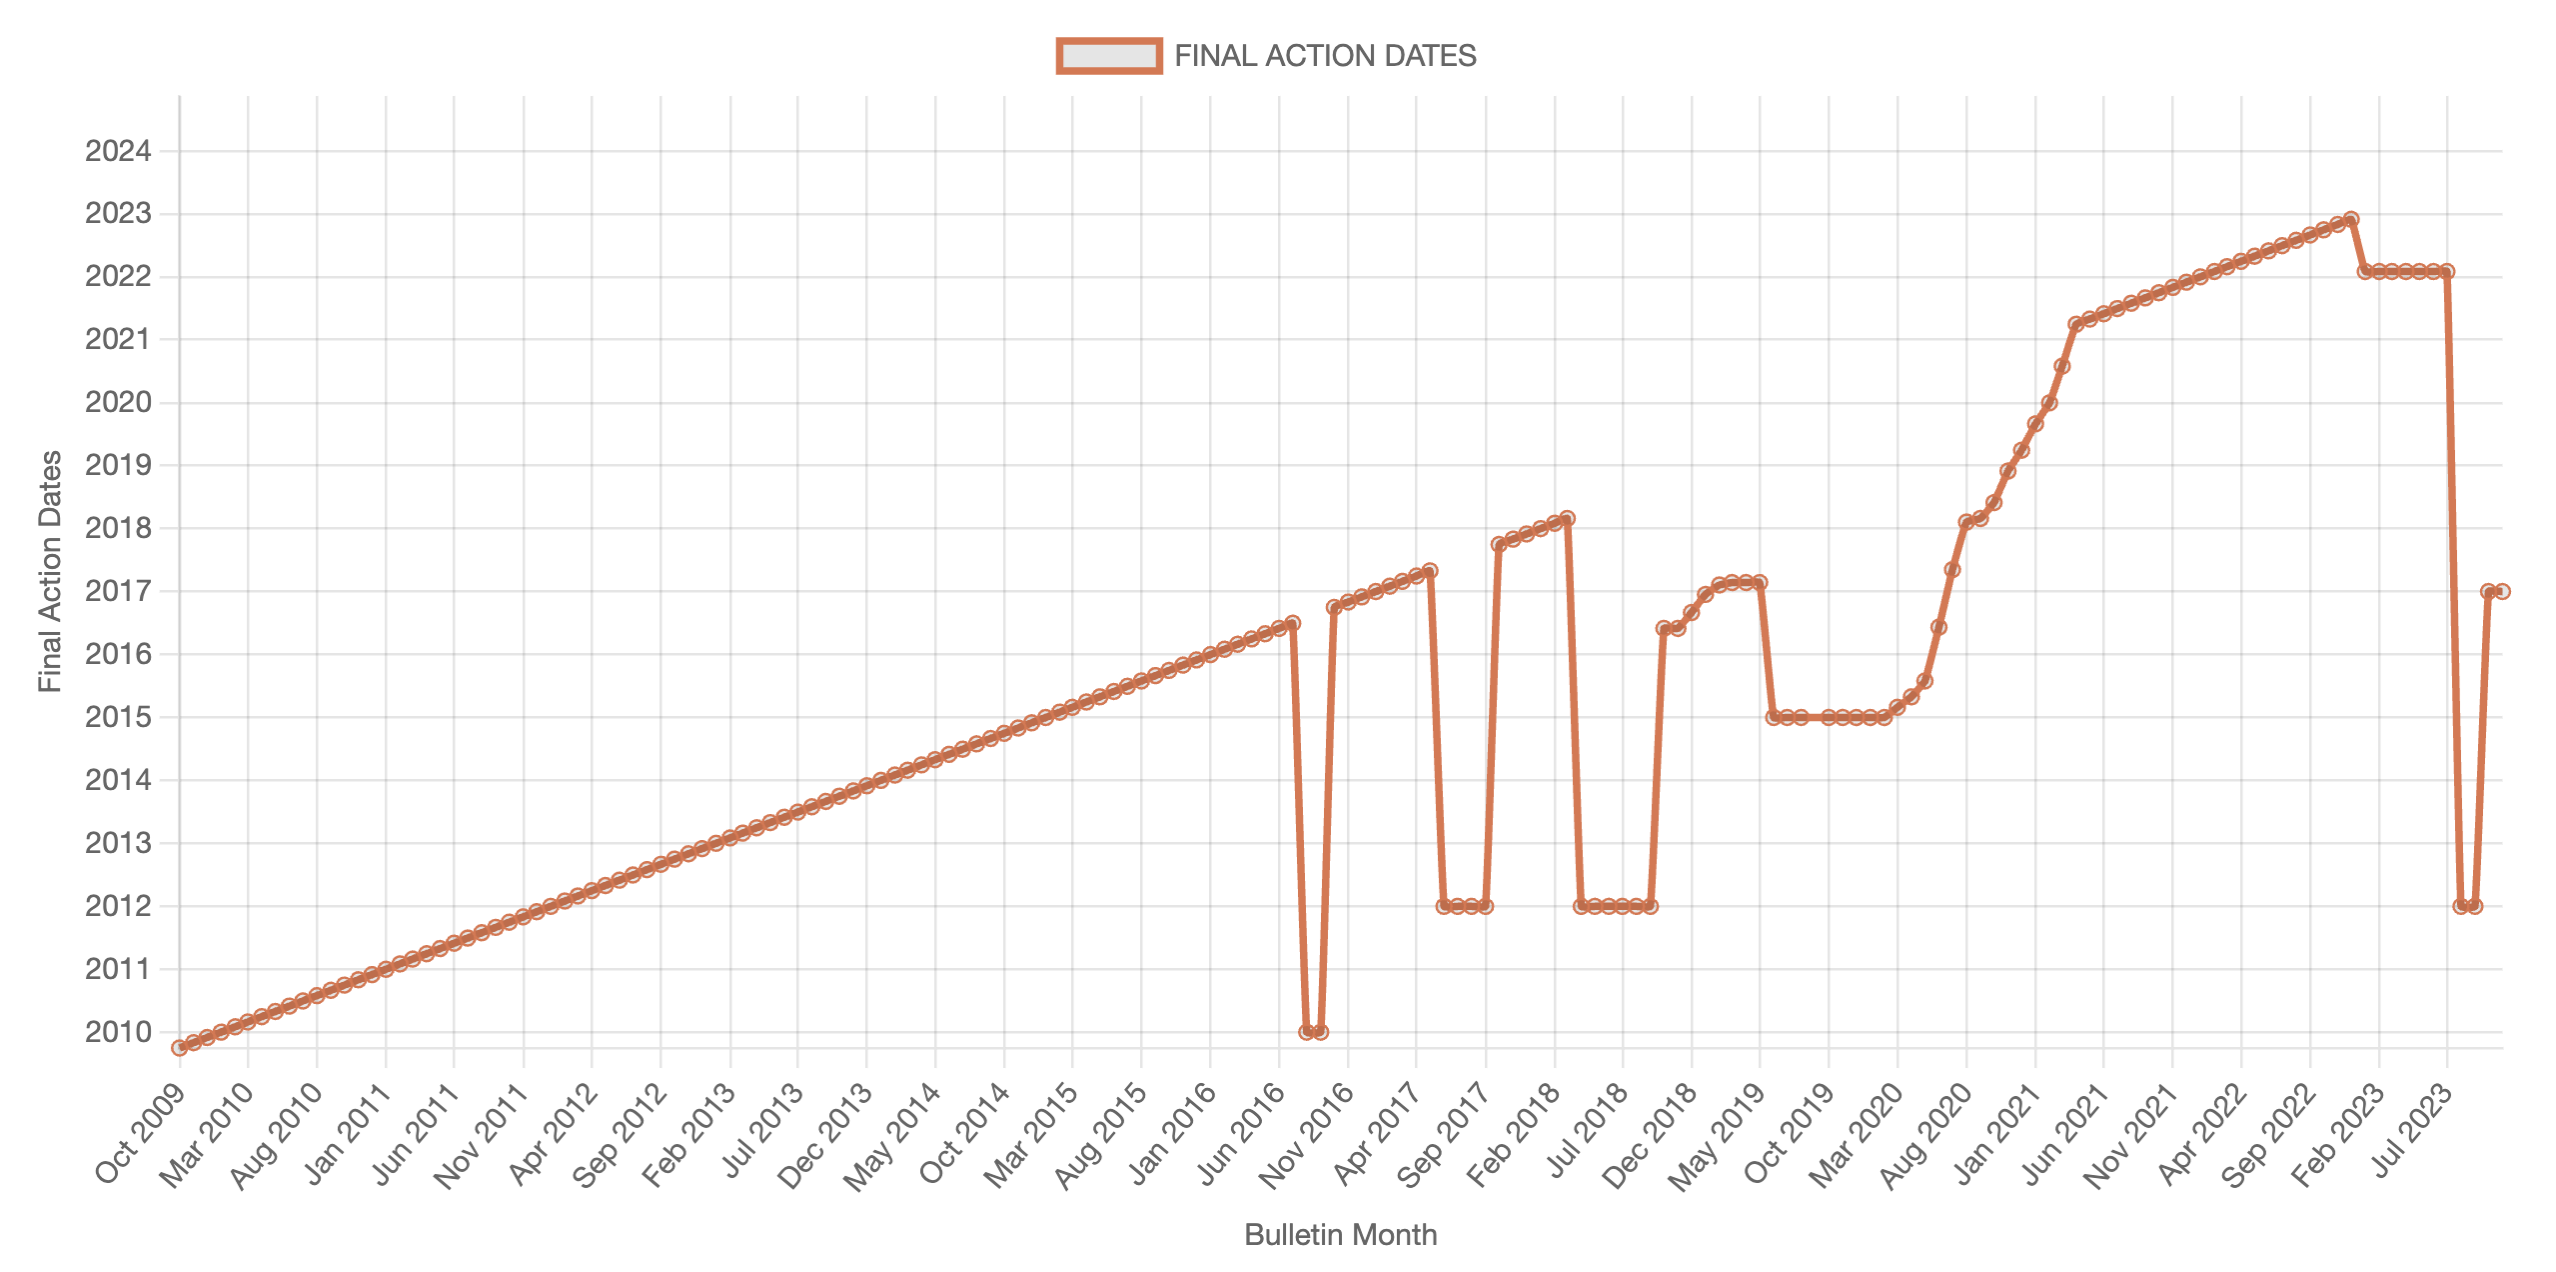
Now we know the visa application load over the years. We can tally that with the visa issued (from piece 3) and taking the difference shows us how the backlog moved over time. Negative values here means the backlog increased. This aligns nicely with the movement of the priority date of EB-1 for Indians.
2012 |
2013 |
2014 |
2015 |
2016 |
2017 |
2018 |
2019 |
2020 |
2021 |
2022 |
2023 (projected) | |
| EB-1 Family | 8,470 |
10,934 |
15,031 |
14,455 |
18,250 |
20,067 |
17,889 |
16,258 |
14,519 |
11,269 |
15,899 |
27,231 |
| EB-1 Issued | 9,506 |
9,640 |
12,978 |
12,253 |
10,985 |
13,082 |
10,967 |
9,008 |
17,014 |
30,825 |
21,437 |
? |
| Backlog Change | 1,036 |
-1,294 |
-2,053 |
-2,202 |
-7,265 |
-6,985 |
-6,922 |
-7,250 |
2,495 |
19,556 |
5,538 |
|
| EB2+3 Family | 52,038 |
48,728 |
57,739 |
75,598 |
114,877 |
99,659 |
95,055 |
110,057 |
89,300 |
152,484 |
121,064 |
210,852 |
| EB2 + 3 Issued | 22,484 |
24,956 |
26,992 |
14,238 |
8,513 |
9,487 |
10,146 |
7,956 |
5,773 |
43,158 |
72,002 |
? |
| Backlog Change | -29,554 |
-23,772 |
-30,747 |
-61,360 |
-106,364 |
-90,172 |
-84,909 |
-102,101 |
-83,527 |
-109,326 |
-49,062 |
EB-2/3 Future Prediction
Given that nearly 210k (!) new Indians apply for the EB-2 and 3 categories, but only ~8k visas get issued, we expect that in a year, the wait time will effectively increases to (1,116,497+210,852-7,956)/7,956 = 166 years for Indians. In other words, the wait time for Indians on EB-2/3 is 140yrs growing at 26yrs every year. EB2/3 applicants have shown a tremendous rise, nearly 2x where it was in 2019! Sadly, this just reinforces what we already known — the EB-2/3 is not a realistic path to a green card any Indian can hope to achieve in their lifetime.
EB-1 Future Prediction
In Jan 2023, the EB-1 priority date regressed slightly to Feb 2022 and stayed that way until June 2023. In August, it regressed a LOT more to 2011 only recovering at the new fiscal year in Oct 2023 to Jan 2017. This reflects our “backlog change” calculation above fairly accurately. This priority date movement retrogressed in 2023 because:
- A lot more Indians are applying for EB-1 in general, up 70% in 2023! — both spurred by using the pandemic as an opportunity to live abroad for 1+yr and come back as a manager on EB-1C, which now has premium processing as of Jan 2023.
- Indians applying for EB-1 port over their old priority dates from EB-2 and 3, which means they effectively cut others in line, retrogressing the priority date significantly.
Assuming 27k new EB-1s every year and 9k EB-1s granted, the pre-pandemic 2019 rate, that means the wait is 2.68yrs growing (27231-9008)/9008 = ~2yrs every year. Now, one might say 9008 is a conservative estimate of how many EB-1s will be granted to Indians. We can even use 17k (the 2020 number) as a liberal estimate. However, a ridiculous 27k people applied, which means the backlog increases eiher way!
Now, let’s assume that 50%+ of those 27k Indians had an older EB-2/3 priority date (I suspects it’s much more). If 13.5k people had an older date, and only 13.5k visas are issued, this means that the priority date movement for EB-1 for Indians effectively freezes because all the granted green cards will be before the current listed visa bulletin priority date. In other words,
- if the number of EB-1s issued to Indians remains somewhat stable over time (no reason to believe it wont) and
- a similar rate of Indians continue to transfer from EB-2 and 3 to EB-1
- a significant number of those have an older priority date
then the EB-1 priority date for India will not move. Even though it stands to reason that 27k is a big spike driven primarily by EB-1C appliants moving back to the US after the pandemic, even if EB-1C numbers come down to pandemic numbers of ~5k principal applicants, keeping the EB-1A/B numbers the same, this means ~7500 principal applicants and ~17.5k applicants with family. If only 10k applicants get accepted, this could still mean a freezing of the EB-1 priority date.
Every Indian applying for a fresh EB-1 after 2023 may actually never get their EB-1!!
I love hearing feedback! If you don't like something, let me know in the comments and feel free to reach out to me. If you did, you can share it with your followers in one click or follow me on Twitter!