Bengaluru Marathon 2018 - Open Data and Statistics
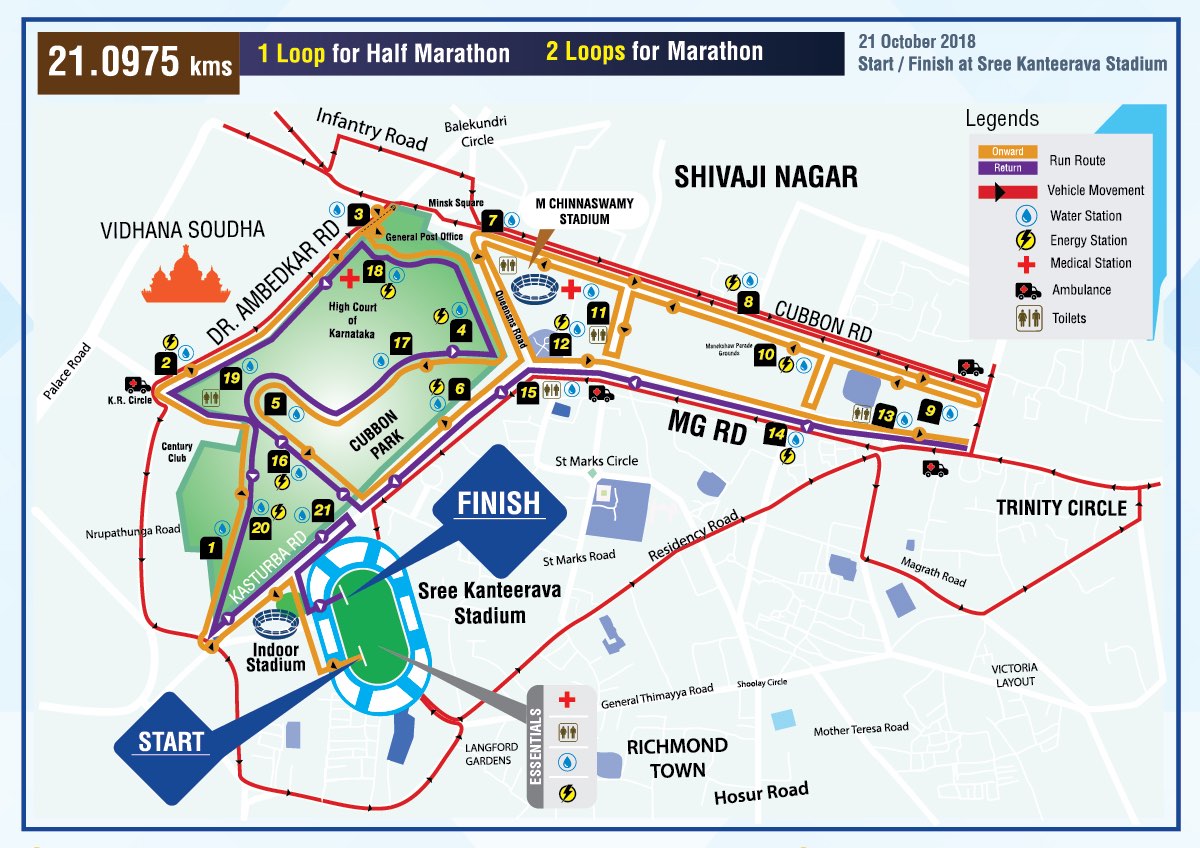
Follow @debarghya_dasOn Sunday, October 21, 2018, Shriram Properties hosted the 5th edition of the Bengaluru Marathon. The event had 3 events, the 5km Hope Run, a Half-Marathon, and a Marathon. The race starts at Kanteerava Stadium, and spans Cubbon Park, Cubbon Road and MG Road. The half-marathon (21km) is a single loop, while the full marathon (42km) is a double loop. The event happened to be my first marathon, and I’ll document my personal experience in another post. In my research on marathons in India, I found myself searching for data and statistics only to find a few uncited media claims. After this experience, I went and grabbed the data myself to open and share for everyone. Scroll down to the bottom for direct links to the data.
Overall, there were 1122 participants in the full marathon, 73.6% of which completed within the limit of 6hrs, and 3921 in the half-marathon, 92.5% of which finished in the stipulated 4hr limit.
The Basics
The Bengaluru full marathon starts at 4:15AM, the half at 6:45AM, and the 5k at 9:15AM. This is important because sunrise occurs at 6:11AM, after which the temperature slowly begins to rise from 18/19C to 25/26C. While large parts of the route are in the shade, under the MG Road Flyover, singificant parts offer no protection from the sun. The humidity steadily falls from around 90% before sunrise to about 60% in the mid-morning. Officially, the time limit of the entire race is 10:15AM, but they wait until 10:45AM to allow the half-marathoners their 4 hour time-limit. Rather unofficially, they wait for all remaining participants on the course to finish.
The route has 21 water stations, at every km, and 10 energy stations, every 2km away from each other. There are also 5 toilets, 2 medical stations dispersed throughout the course. It’s worth knowing that because large portions of the track have both forward and reverse paths of the loop, in effect, a runner has access to water and energy more often than 1 and 2kms. During the first lap, they distributed water in small ~100ml plastic cups and electrolytes (through a sponsor’s drink Enerzal) at the water stations. On the second lap, the Enerzal stock was depleted, but they had bananas, jaggery and salt. The medical stations had attendants and most importantly, Volini, a pain relieving anti-inflammatory.
Data
The only media mention I found was an article on Indian Express which says there were 2,000 marathon runners and 7,000 half-marathon runners. It’s likely that these numbers are wrong, and obtained by taking an upper bound of the bib numbers of the race. For marathoners, the bibs ranged, quite cleverly might I add, from 42000 to about ~44500 while the half-marathoners ranged from about 21000 to 28000.
I obtained the raw data from TimingIndia, the official timers of the event. Timers make sure the runners have hit all the checkpoints in the race. From the timers, we can get names, bib numbers, categories, ranks, total time, and the splits at different markers across the track and delve into more exciting statistics.
Marathon
Overall Statistics
Overall, it looks like 1122 runners participated in the full marathon. It’s unclear whether this is the total number of registrations or starters, but given that it seems all but 5 made the first 1.5km split, the difference is negligible. Although, officially on each of the result pages they report a total of 903 finishers, there’s a candidate who was actually ranked 904th and from the data I could only find 894 finishers. Although the organizers were gracious enough to let all the runners, finish, keeping the regulation 6 hour time limit for marathons in mind, there were 826 finishers, giving us a completion rate of 73.6%.
| Total Runners | 1122 |
| Finishers | 894 |
| Finishers (< 6hrs) | 826 |
| Completion Rate | 79.7% |
| Completion Rate (< 6hrs) | 73.6% |
Gender Breakdown
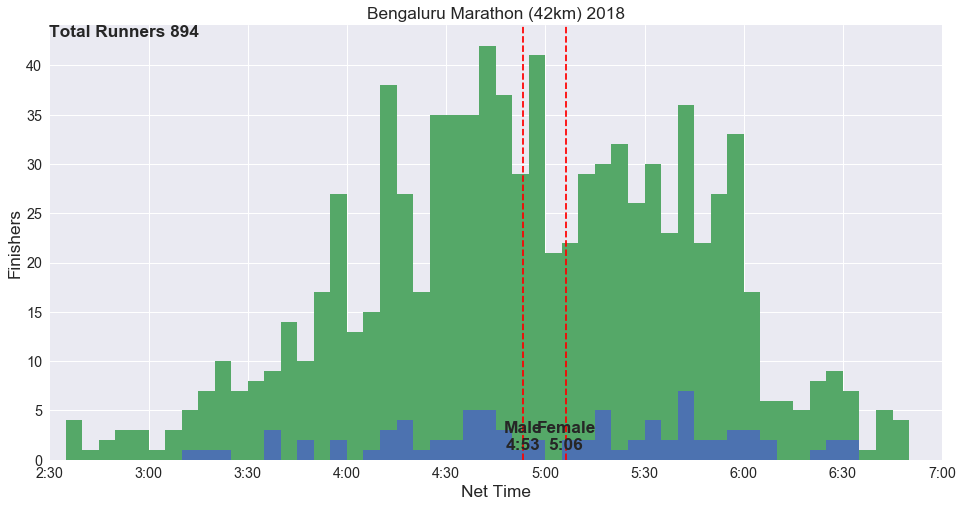
Here’s a gender breakdown. Unfortunately, the gender distribution is still pretty paltry by international standards, at 10.2% here vs 30% globally.
| Gender | Runners | %age |
|---|---|---|
| Male | 1007 | 89.8% |
| Female | 115 | 10.2% |
Category Breakdown
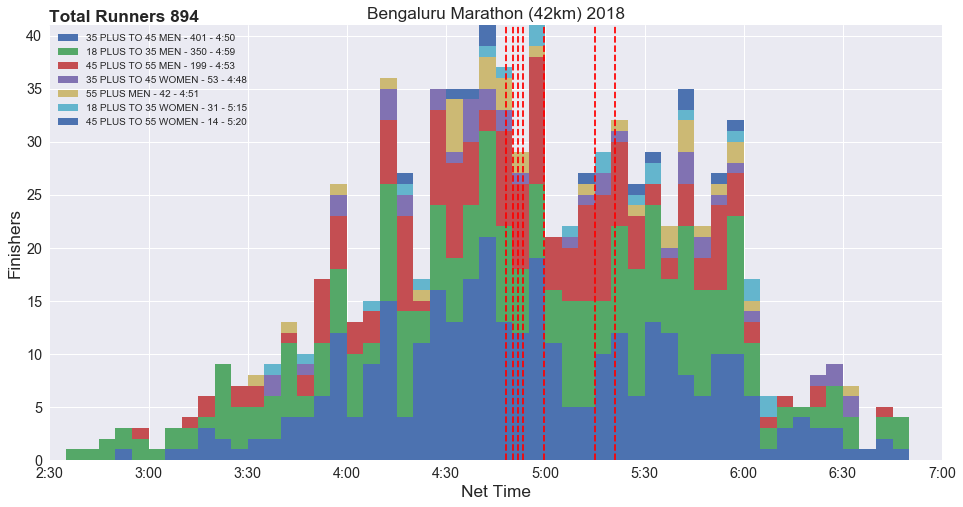
Surprisingly, amongst 1090 runners who were assigned an age category, only 381 runners or 35% were in the 18 to 35 age category, with 41.6% in the 35 to 45 category and a remarkable 23.4% were above 45 years of age. The other categories (under 1%) not listed here are SPECIAL WOMEN, PACER MEN, FASTEST MARATHON WOMEN, FASTEST MARATHON MEN, PACER WOMEN, SPECIAL MEN and NE MEN (not sure what this is).
| Category | Runners | %age |
|---|---|---|
| 35 PLUS TO 45 MEN | 401 | 35.7% |
| 18 PLUS TO 35 MEN | 350 | 31.2% |
| 45 PLUS TO 55 MEN | 199 | 17.7% |
| 35 PLUS TO 45 WOMEN | 53 | 4.7% |
| 55 PLUS MEN | 42 | 3.7% |
| 18 PLUS TO 35 WOMEN | 31 | 2.8% |
| 45 PLUS TO 55 WOMEN | 14 | 1.2% |
| 55 PLUS WOMEN | 1 | <1% |
Percentile Charts
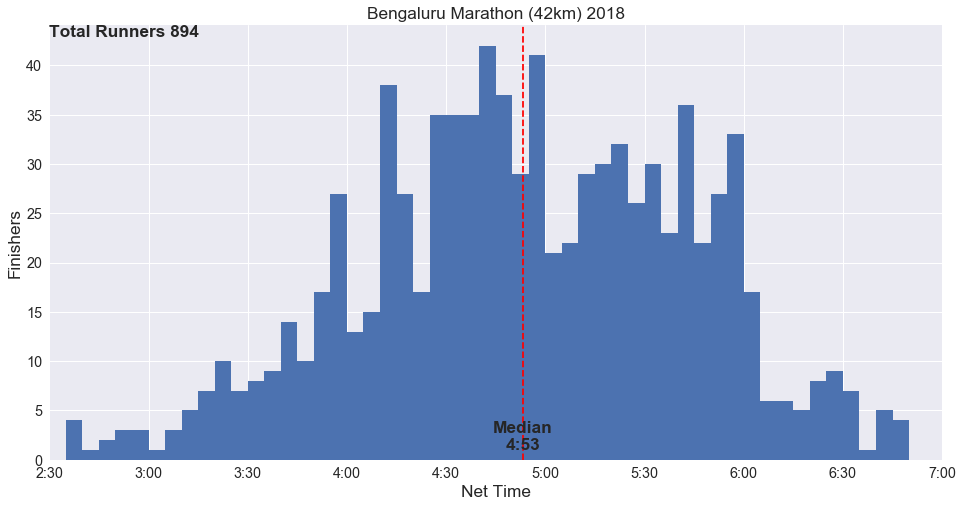
The fastest time was 2:35:20 and the slowest recorded finisher was 6:46:42. Here’s a basic percentile chart (amongst finishers). The interquartile range was 4:19 to 5:32, where most runners finished.
| Percentile | Time |
|---|---|
| 100% | 2:35 |
| 99% | 2:53 |
| 95% | 3:29 |
| 90% | 3:50 |
| 75% | 4:19 |
| 50% | 4:53 |
| 25% | 5:32 |
| 10% | 5:57 |
| 5% | 6:10 |
| 1% | 6:36 |
| 0% | 6:46 |
And here’s a reverse percentile chart:
| Time | Percentile | Finishers |
|---|---|---|
| 2:30 | 100% | 0 |
| 2:45 | 99.4% | 5 |
| 3:00 | 98.5% | 13 |
| 3:15 | 97.5% | 22 |
| 3:30 | 94.9% | 46 |
| 3:45 | 91.4% | 77 |
| 4:00 | 85.3% | 131 |
| 4:15 | 78.0% | 197 |
| 4:30 | 69.1% | 276 |
| 4:45 | 56.4% | 390 |
| 5:00 | 44.6% | 495 |
| 5:15 | 36.5% | 568 |
| 5:30 | 26.7% | 655 |
| 5:45 | 16.8% | 744 |
| 6:00 | 7.6% | 826 |
| 6:15 | 4.4% | 855 |
| 6:30 | 1.9% | 877 |
| 6:45 | 0.4% | 890 |
Miscellaneous
A common metric measured in marathon races is negative split, when you race the second half of the race faster than the first. Only 45 runners managed to maintain a negative split in this race, with 113 completing their second half upto 5 minutes slower than the first and 199 completing it upto 10 minutes slower than their first. If we use this as a proxy for those who executed their race-day strategy, that’s only about 17.7% of runners. Higher temperatures during the latter half of the race makes getting a negative split even harder if you took longer than 2 hours to finish.
Half-Marathon
Overall Statistics
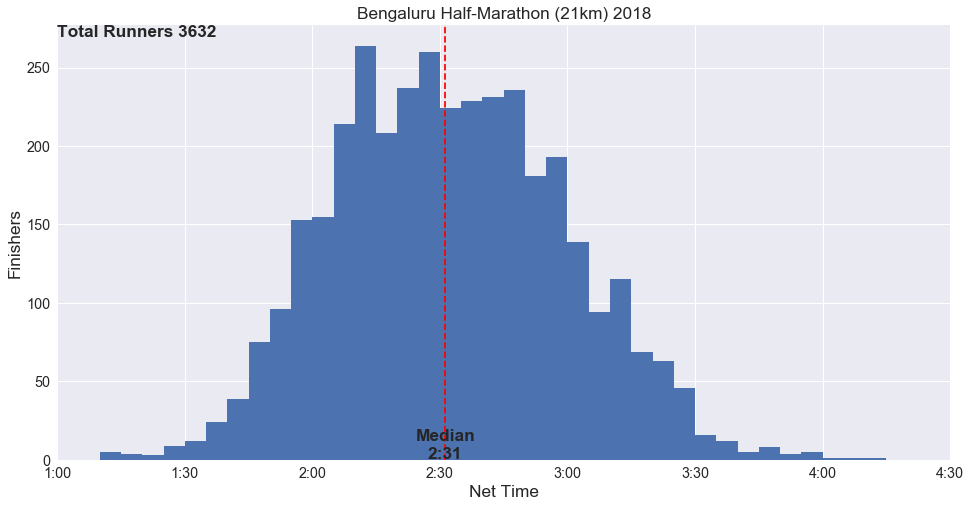
A total of 3921 runners participated in the half marathon (not 7000, as quoted in the media). Here too, there’s a disparity between the reported (3656)and found finishers (3632), albeit small. All but 4 of those finishers finished within the standard 4hr time limit, making for a completion rate of 92.5%. However, if we drop this to 3hrs, half the marathon time liimt, the completion rate falls to 77.8%.
| Total Runners | 3921 |
| Finishers | 3632 |
| Finishers (<4hrs) | 3628 |
| Finishers (<3hrs) | 3052 |
| Completion Rate | 92.6% |
| Completion Rate (<4hrs) | 92.5% |
| Completion Rate (<3hrs) | 77.8% |
Gender Breakdown
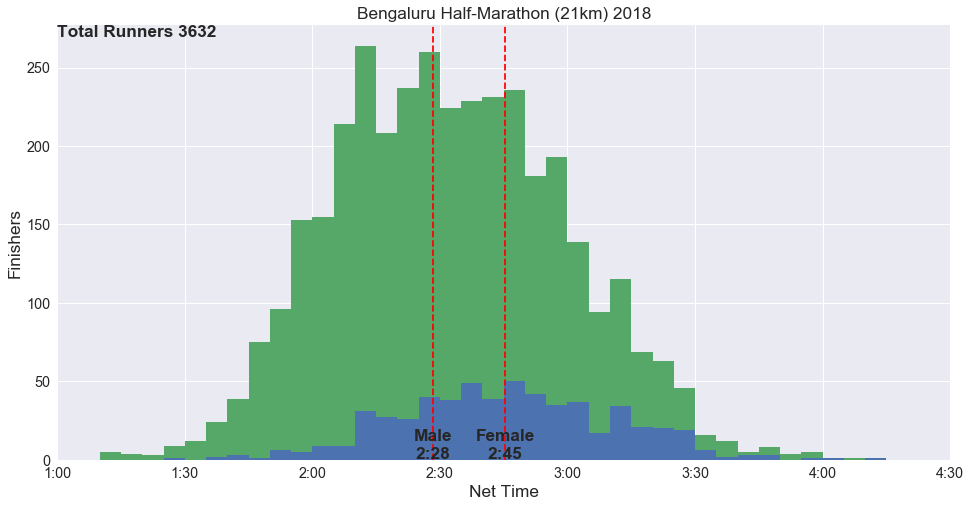
The half marathon gender breakdown looks a lot better than the marathon, at 17%.
| Gender | Runners | %age |
|---|---|---|
| Male | 3256 | 83.0% |
| Female | 665 | 17.0% |
Category Breakdown
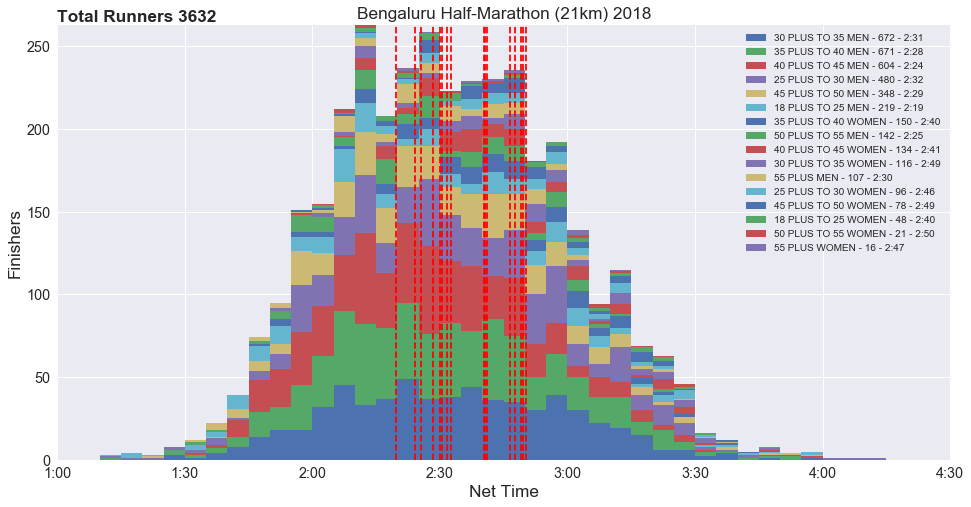
Here too, the trend of younger participants (<30 years old) at 21.5% being fewer than the middle-aged demographic (30-45) at ~60% struck me by surprise. The other categories (under 2%) not listed here are PACER MEN, FASTEST HALF MARATHON WOMEN, PACER WOMEN, NE MEN, FASTEST HALF MARATHON MEN and 18 PLUS TO 35 MEN.
| Category | Runners | %age |
|---|---|---|
| 30 PLUS TO 35 MEN | 672 | 17.1% |
| 35 PLUS TO 40 MEN | 671 | 17.1% |
| 40 PLUS TO 45 MEN | 604 | 15.4% |
| 25 PLUS TO 30 MEN | 480 | 12.2% |
| 45 PLUS TO 50 MEN | 348 | 8.9% |
| 18 PLUS TO 25 MEN | 219 | 5.6% |
| 35 PLUS TO 40 WOMEN | 150 | 3.8% |
| 50 PLUS TO 55 MEN | 142 | 3.6% |
| 40 PLUS TO 45 WOMEN | 134 | 3.4% |
| 30 PLUS TO 35 WOMEN | 116 | 3.0% |
| 55 PLUS MEN | 107 | 2.7% |
| 25 PLUS TO 30 WOMEN | 96 | 2.4% |
| 45 PLUS TO 50 WOMEN | 78 | 2.0% |
| 18 PLUS TO 25 WOMEN | 48 | <2% |
| 50 PLUS TO 55 WOMEN | 21 | <2% |
| 55 PLUS WOMEN | 16 | <2% |
Percentile Charts
The fastest time was 1:08:54 and the slowest recorded finisher was 4:34:23. Here’s a basic percentile chart (amongst finishers). The interquartile range was 2:12 to 2:15, where most runners finished. Interestingly, the half-marathon winner, Evans Saitoti, downgraded from the full marathon (given his 42000+ bib number).
| Percentile | Time |
|---|---|
| 100% | 1:08 |
| 99% | 1:36 |
| 95% | 1:50 |
| 90% | 1:58 |
| 75% | 2:12 |
| 50% | 2:31 |
| 25% | 2:51 |
| 10% | 3:08 |
| 5% | 3:18 |
| 0% | 4:34 |
And here’s a reverse percentile chart:
| Time | Percentile | Finishers |
|---|---|---|
| 1:00 | 100.0% | 0 |
| 1:15 | 99.9% | 5 |
| 1:30 | 99.4% | 21 |
| 1:45 | 97.4% | 96 |
| 2:00 | 88.4% | 420 |
| 2:15 | 71.0% | 1054 |
| 2:30 | 51.6% | 1758 |
| 2:45 | 32.7% | 2443 |
| 3:00 | 16.0% | 3052 |
| 3:15 | 6.4% | 3400 |
| 3:30 | 1.5% | 3579 |
| 3:45 | 0.6% | 3611 |
| 4:00 | 0.1% | 3628 |
Open Data
The raw data from the marathon spreadsheet is embedded below. The marathon data is available here and the half-marathon data here.
I love hearing feedback! If you don't like something, let me know in the comments and feel free to reach out to me. If you did, you can share it with your followers in one click or follow me on Twitter!