The Largest Analysis of Engineering Salaries in India
Follow @deedydasIndia has a booming engineering talent ecosystem, concentrated around Bengaluru, Delhi and Mumbai. Many US-based companies find it easier to recruit high-quality and lowest cost talent, and those wages drive compensation from an increasing number of Indian startups. In the US, over time there’s been a big push for salary and compensation (often referred to in India as “package”) particularly with products like levels.fyi. Legacy products like Glassdoor and Payscale are wildly inaccurate.
In this article, we analyze a high fidelity dataset of 25,000 people’s salary information containing:
- Years of Experience
- Salary
- Variable Salary / Bonus
- Equity / Stock-based compensation
- Company Name(s)

The data is collected in 2024 from a Y Combinator W21 startup called Weekday that works on recruiting Indian talent. Note that while the data is self-reported, it generally seems in line with anecdotal data from the industry.

Most Popular Companies

| Company | Count | Avg Total Comp (LPA) | Median Total Comp | Std Dev Total Comp | Median Salary | Median Bonus | Median Stock |
|---|---|---|---|---|---|---|---|
| 169 | 66 | 60 | 33.4 | 35 | 5 | 20 | |
| Gojek | 96 | 59.7 | 55.5 | 25.9 | 42.5 | 5 | 5.5 |
| Microsoft | 594 | 58.5 | 52 | 28.3 | 33 | 5 | 12 |
| Zeta | 74 | 58 | 50 | 31.1 | 40 | 3 | 4.8 |
| Adobe | 130 | 56.3 | 51.9 | 26.9 | 32.5 | 4 | 13.5 |
| Salesforce | 112 | 56.1 | 48 | 25.4 | 35 | 4 | 10 |
| VMWare | 201 | 53 | 46 | 26.9 | 33 | 5 | 7 |
| ShareChat | 173 | 52.1 | 46 | 23.2 | 33.8 | 3 | 9 |
| Goldman Sachs | 80 | 51.4 | 42 | 27.9 | 33.5 | 6 | 0.1 |
| Paypal | 207 | 50.6 | 47 | 22.8 | 32 | 3 | 10 |
| Myntra | 82 | 50.6 | 46 | 26.1 | 32 | 2 | 8 |
| Walmart | 431 | 50.4 | 45 | 23.3 | 32 | 6 | 5 |
| ServiceNow | 82 | 48.8 | 40.5 | 24.9 | 26.5 | 3 | 10 |
| Flipkart | 236 | 45.5 | 37.4 | 25.4 | 27 | 3 | 6 |
| Razorpay | 96 | 45 | 41.5 | 24.6 | 32 | 1.4 | 5 |
| Oracle | 203 | 44.3 | 38.5 | 24.1 | 26.5 | 3 | 10 |
| Amazon | 616 | 44.2 | 37 | 26 | 25 | 4 | 5 |
| Tekion | 91 | 43.9 | 35.5 | 26.7 | 27 | 2 | 8 |
| Cisco | 105 | 40.8 | 32.2 | 23.9 | 25 | 3 | 5 |
| PayTM | 141 | 40.5 | 31 | 28.7 | 25 | 2 | 4 |
| Qualcomm | 95 | 38.7 | 36 | 16 | 22 | 3 | 8 |
| SAP | 103 | 38.2 | 32 | 21.9 | 23 | 3 | 4 |
| Oyo | 81 | 36.1 | 28 | 23.2 | 22 | 3 | 4 |
| IBM | 69 | 30.2 | 24 | 23 | 19 | 1 | 0 |
| Samsung | 72 | 29.6 | 24.5 | 17.6 | 19.5 | 2 | 0 |
| Accenture | 133 | 22.8 | 18.6 | 16.5 | 15.3 | 2 | 0 |
| Cognizant | 80 | 18.3 | 14 | 14.4 | 8.1 | 0.6 | 0 |
| Infosys | 90 | 18.2 | 10.9 | 17.5 | 10 | 1 | 0 |
| Capgemini | 78 | 16.8 | 12.5 | 13.8 | 8.6 | 0 | 0 |
| TCS | 146 | 14.9 | 9.4 | 12.8 | 8 | 0.7 | 0 |
Highest Paying Companies
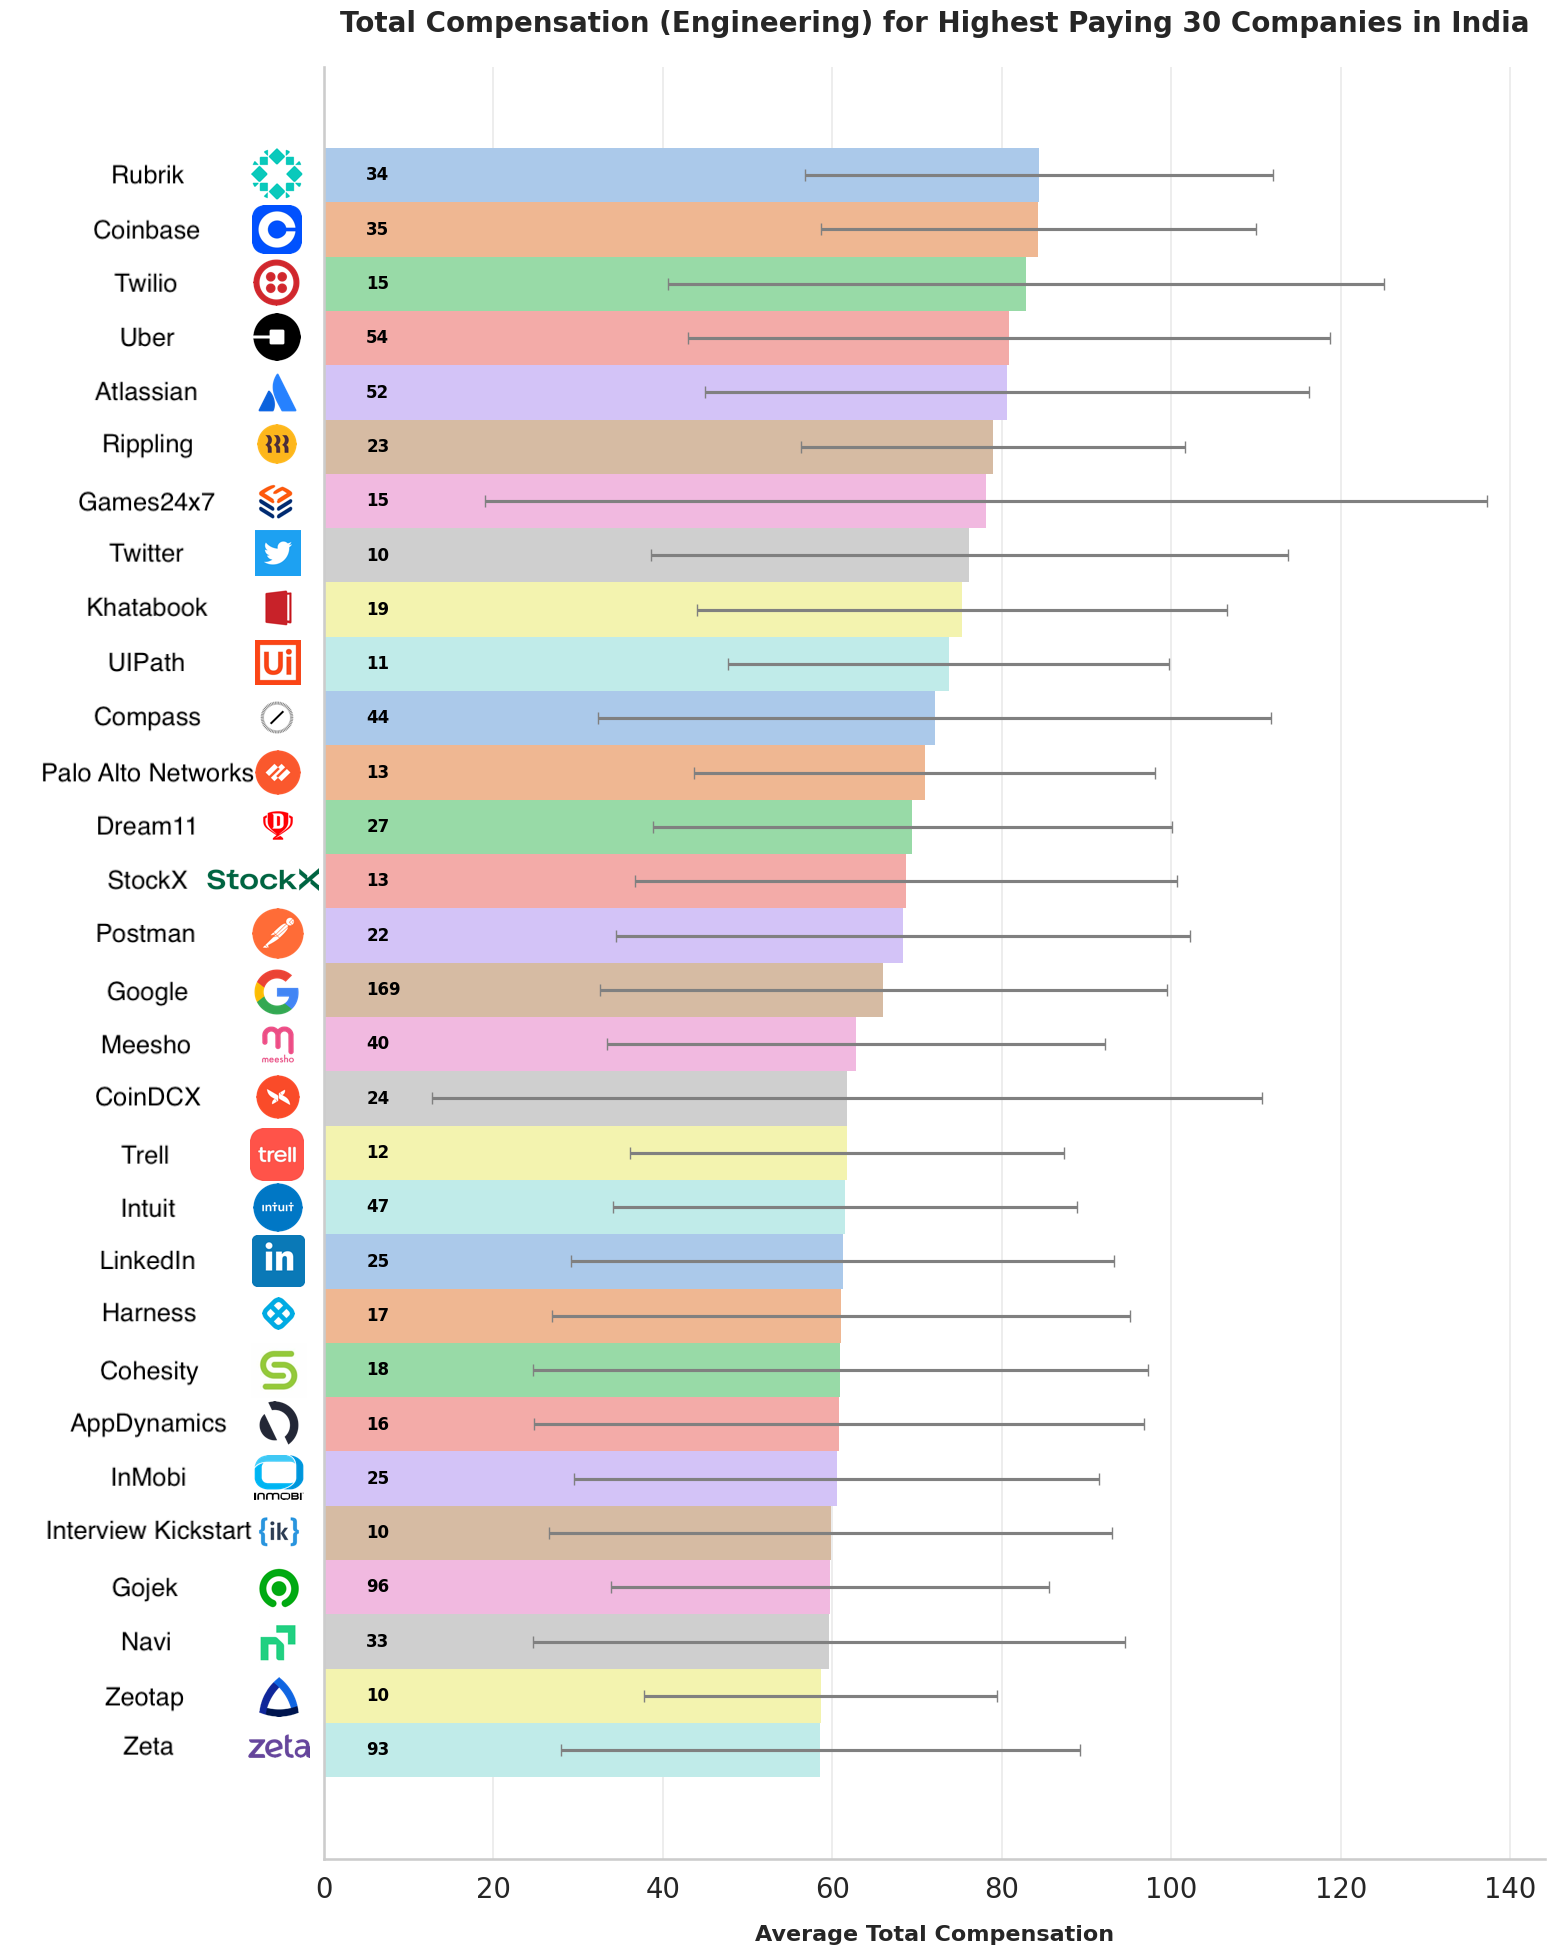
| Company | Count | Avg Total Comp (LPA) | Median Total Comp | Std Dev Total Comp | Median Salary | Median Bonus | Median Stock |
|---|---|---|---|---|---|---|---|
| Rubrik | 34 | 84.4 | 83 | 27.6 | 43 | 6.6 | 32.5 |
| Coinbase | 35 | 84.3 | 71 | 25.7 | 46 | 5 | 21 |
| Twilio | 15 | 82.9 | 73 | 42.2 | 50 | 5.3 | 16 |
| Uber | 54 | 80.8 | 76 | 37.9 | 46 | 7.5 | 20 |
| Atlassian | 52 | 80.6 | 79.5 | 35.7 | 48.5 | 6.4 | 20 |
| Rippling | 23 | 79 | 77 | 22.6 | 55 | 0 | 20 |
| Games24x7 | 15 | 78.1 | 50 | 59.1 | 39 | 5 | 8 |
| 10 | 76.1 | 86.5 | 37.6 | 45 | 9 | 22.5 | |
| Khatabook | 19 | 75.3 | 68 | 31.2 | 50.5 | 5 | 12.5 |
| UIPath | 11 | 73.7 | 67.2 | 26 | 38 | 5.7 | 20 |
| Compass | 44 | 72.1 | 60 | 39.7 | 45 | 5.1 | 10 |
| Palo Alto Networks | 13 | 70.9 | 78 | 27.2 | 42 | 5 | 16 |
| Dream11 | 27 | 69.4 | 60 | 30.7 | 47.5 | 3.4 | 10 |
| StockX | 13 | 68.7 | 53 | 32 | 39 | 5 | 10 |
| Postman | 22 | 68.3 | 66.5 | 33.8 | 42.5 | 3.5 | 10.5 |
| 169 | 66 | 60 | 33.4 | 35 | 5 | 20 | |
| Meesho | 40 | 62.8 | 57 | 29.4 | 46 | 2.8 | 10 |
| CoinDCX | 24 | 61.7 | 51.5 | 49 | 40 | 2 | 3 |
| Trell | 12 | 61.7 | 60 | 25.6 | 42.5 | 4.5 | 7.5 |
| Intuit | 47 | 61.5 | 55 | 27.4 | 36 | 5 | 10 |
| 25 | 61.2 | 60.7 | 32 | 35 | 3.7 | 20 | |
| Harness | 17 | 61 | 67 | 34.1 | 36 | 4 | 15 |
| Cohesity | 18 | 60.9 | 53.1 | 36.3 | 33 | 3 | 16 |
| AppDynamics | 16 | 60.8 | 48 | 36 | 34.5 | 5 | 10 |
| InMobi | 25 | 60.5 | 57.5 | 31 | 46 | 3 | 8 |
| Interview Kickstart | 10 | 59.8 | 55.5 | 33.2 | 42.5 | 4.5 | 8.5 |
| Gojek | 96 | 59.7 | 55.5 | 25.9 | 42.5 | 5 | 5.5 |
| Navi | 33 | 59.6 | 52 | 34.9 | 40 | 4 | 5 |
| Zeotap | 10 | 58.6 | 57 | 20.9 | 37 | 5 | 8.8 |
| Zeta | 93 | 58.6 | 50 | 30.6 | 40 | 4 | 5 |
Lowest Paying Companies
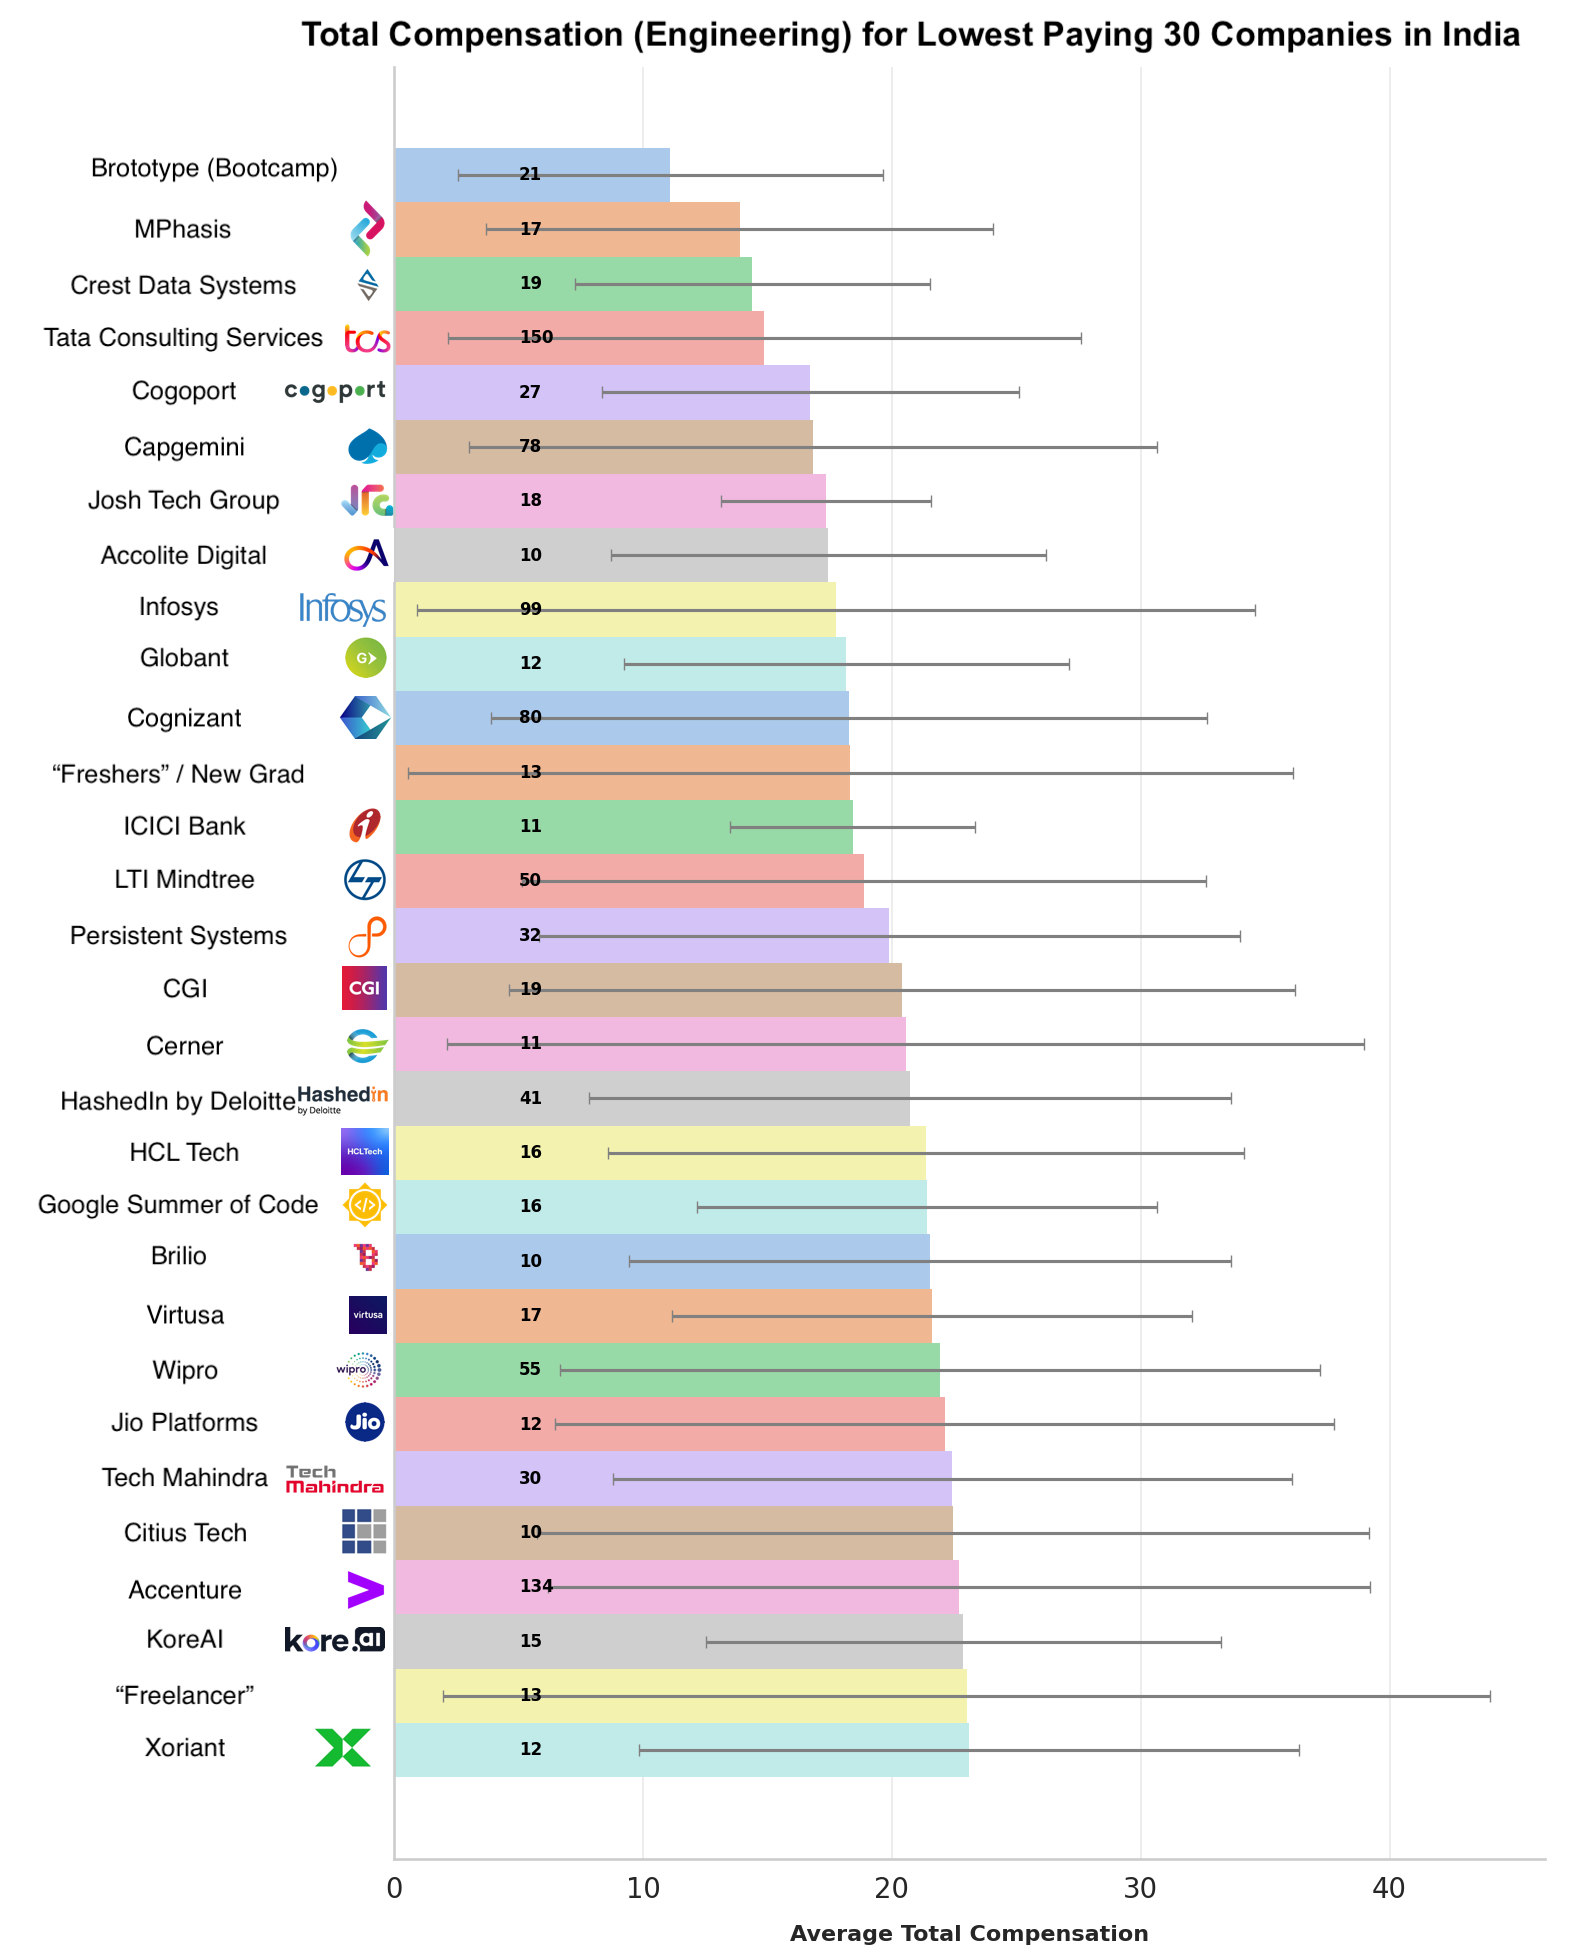
| Company | Count | Avg Total Comp (LPA) | Median Total Comp | Std Dev Total Comp | Median Salary | Median Bonus | Median Stock |
|---|---|---|---|---|---|---|---|
| Brototype (Bootcamp) | 21 | 11.1 | 6.5 | 8.5 | 3 | 2 | 2 |
| MPhasis | 17 | 13.9 | 12.5 | 10.2 | 12 | 0.5 | 0 |
| Crest Data Systems | 19 | 14.4 | 13 | 7.1 | 12 | 0 | 0 |
| Tata Consultancy Services | 150 | 14.9 | 9.4 | 12.7 | 8 | 0.7 | 0 |
| Cogoport | 27 | 16.7 | 14 | 8.4 | 12 | 2 | 0 |
| Capgemini | 78 | 16.8 | 12.5 | 13.8 | 8.6 | 0 | 0 |
| Josh Technology Group | 18 | 17.3 | 17 | 4.2 | 12 | 2 | 1 |
| Accolite Digital | 10 | 17.4 | 15.1 | 8.7 | 11.1 | 1.5 | 0 |
| Infosys | 99 | 17.8 | 11 | 16.9 | 10 | 1 | 0 |
| Globant | 12 | 18.2 | 20.5 | 8.9 | 20.5 | 0 | 0 |
| Cognizant | 80 | 18.3 | 14 | 14.4 | 8.1 | 0.6 | 0 |
| “Fresher” | 13 | 18.3 | 9.8 | 17.8 | 5 | 2 | 2 |
| ICICI Bank | 11 | 18.4 | 16.5 | 4.9 | 12 | 4.5 | 0 |
| LTI MindTree | 50 | 18.9 | 14.2 | 13.7 | 11.2 | 0.5 | 0 |
| Persistent Systems | 32 | 19.9 | 15.3 | 14.1 | 12 | 1.2 | 0 |
| CGI | 19 | 20.4 | 12 | 15.8 | 10.5 | 0.5 | 0 |
| Cerner | 11 | 20.6 | 13.1 | 18.4 | 8 | 1.2 | 0 |
| HashedIn by Deloitte | 41 | 20.7 | 20 | 12.9 | 15 | 2 | 0 |
| HCL Technologies | 16 | 21.4 | 18.8 | 12.8 | 15.1 | 1.6 | 0 |
| Google Summer of Code | 16 | 21.4 | 21 | 9.2 | 15 | 3 | 1.5 |
| Brilio | 10 | 21.5 | 21.2 | 12.1 | 20.2 | 0 | 0 |
| Virtusa | 17 | 21.6 | 22.4 | 10.5 | 19.6 | 0.8 | 0 |
| Wipro | 55 | 21.9 | 16 | 15.3 | 15 | 1 | 0 |
| Jio Platforms | 12 | 22.1 | 16.5 | 15.7 | 13 | 2 | 0 |
| Tech Mahindra | 30 | 22.4 | 22 | 13.6 | 16.8 | 1.5 | 0 |
| CitiusTech | 10 | 22.5 | 14.3 | 16.7 | 12.8 | 1.3 | 0 |
| Accenture | 134 | 22.7 | 18.6 | 16.5 | 15.2 | 2 | 0 |
| KoreAI | 15 | 22.9 | 22 | 10.4 | 22 | 0 | 0 |
| “Freelancer” | 13 | 23 | 21.2 | 21.1 | 10 | 0 | 0 |
| Xoriant | 12 | 23.1 | 20.2 | 13.3 | 20.2 | 0 | 0 |
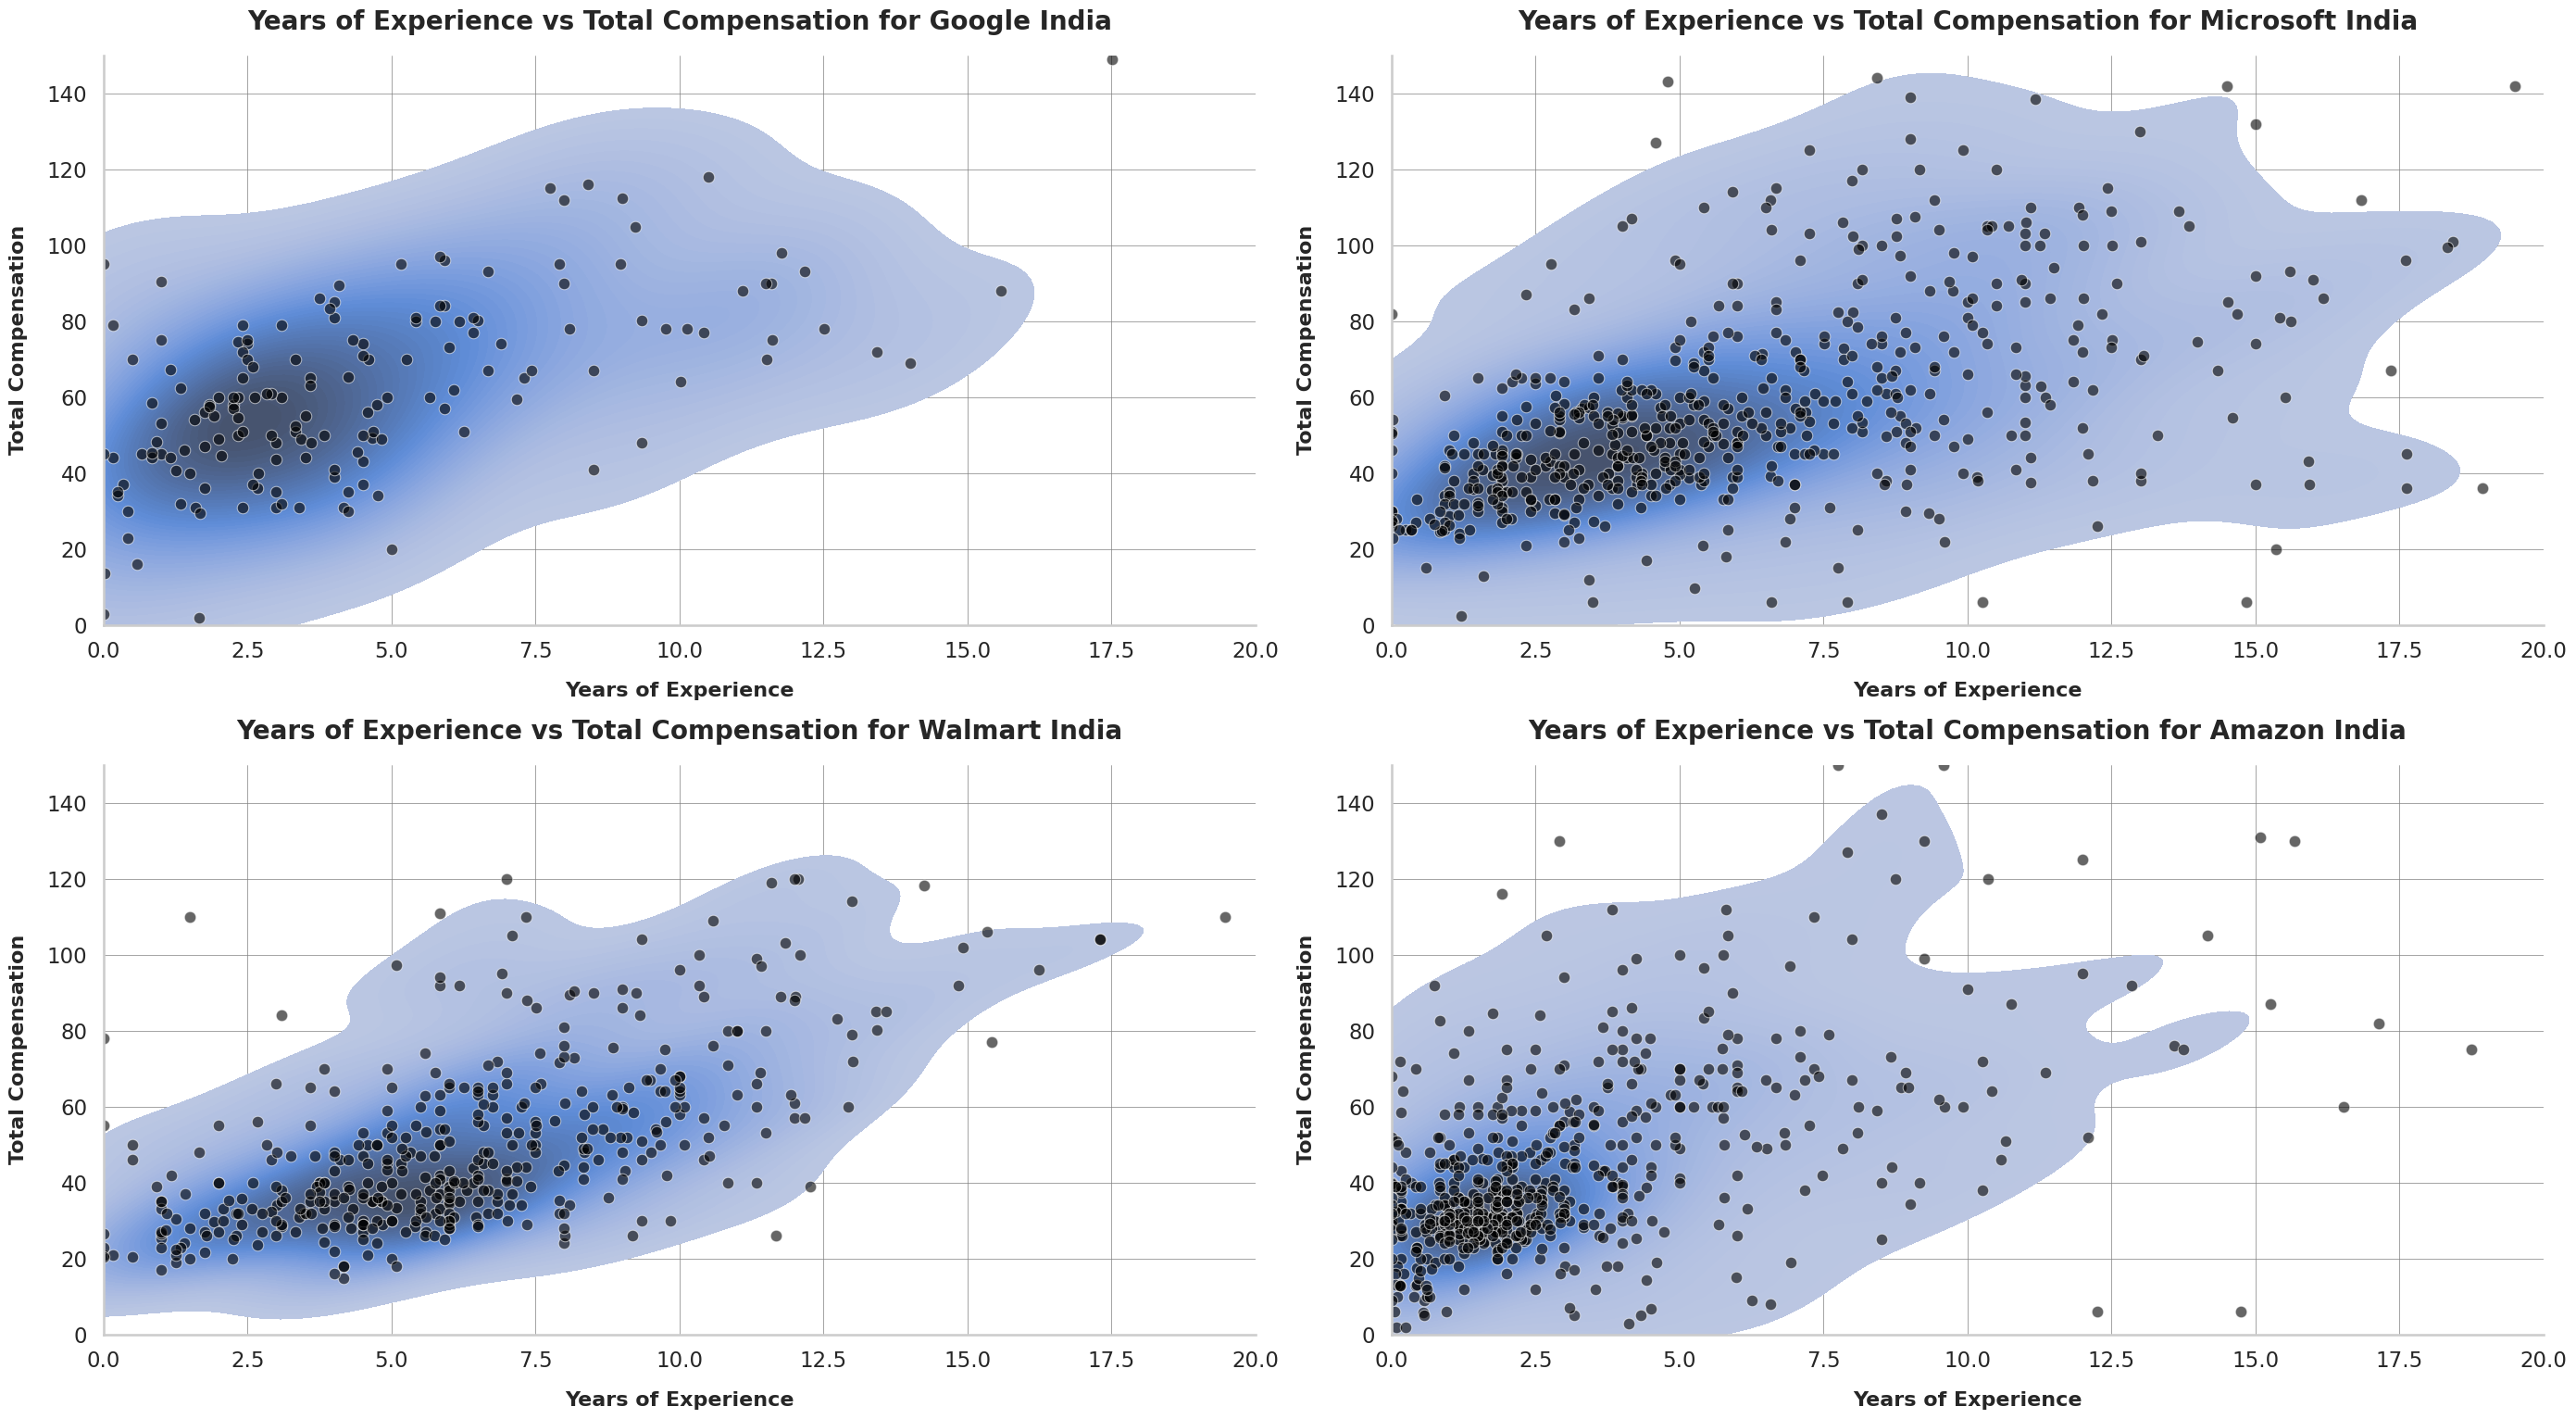
Years of Experience vs Total Compensation
A valid criticism for the above analysis is that it doesn’t tease apart years of experience as a factor for compensation. Overall, the distribution of years of experience across companies is usually similar enough for comparisons to still be valid. We tried to uncover how experience dictates compensation, but the data was too noisy across companies. Instead, we look at the biggest BigTech multinational companies (MNCs) and look at this relationship within each company: Google, Microsoft, Amazon and Walmart.
Data Cleaning
When performing any sort of data analysis, it’s critical to be transparent with how you clean the data. Here were all the steps:
- Remove outliers: bottom 1% contains monthly salary, and top 2% which contain extra 0s or unrealistic numbers
- Normalize company names: lowercase, remove punctuation, remove stopwords (corp, india), use the first company when a list is provided, and manually map certain names (“tata consultancy services” -> TCS)
- Compute Total Compensation: add annual salary, variable salary and annual stock compensation.
This, of course, still has blunders. This data isn’t perfect and I wanted to call out all of the ways it may not answer the questions we’re trying to ask:
- Self-reported layer can contain outright lies.
- Outlier pruning isn’t perfect, and there are samples like company “me” that make “170” comp.
- The samples are biased to the source of the data. It heavily favors younger people looking for jobs, and may not be truly reflective of a company’s true pay philosophy.
- Not all companies are covered.
- Stock compensation does not always account for the vesting schedule or the liquidity of the stock, in case of private companies.
- Stock compensation of private (and public) companies are tied to a certain valuation that may be far from the real valuation at liquidity.
- Certainty of achieving the annual bonus is not factored in.
- Normalizing names of companies is far from perfect and may miss data points.
Conclusion
The goal of this effort is to bring more transparency in pay into the Indian market to help employees make betteter decisions about their job. My aim is to make this data freely available and easy to understand.
The entire dataset both raw and processed is available as a published Google Sheet here. Thanks @NirantK for providing the raw source dataset.
I love hearing feedback! If you don't like something, let me know in the comments and feel free to reach out to me. If you did, you can share it with your followers in one click or follow me on Twitter!